
 Submit Manuscript
Research Article | Open Access
Experience with non-drug strategies in women with metabolic syndrome during the menopausal transition: a focus on cardiovascular risk
R.R. Berikhanova 1, I.A. Minenko 2, S.A. Bondarev3
1Federal State Budgetary Institution “Central Clinical Hospital of Civil Aviation”, Moscow, Russia.
2Department of Integrative Medicine FGAOU VO "First Moscow State Medical University named after I.M. Sechenov", Moscow, Russia.
3Cardiologist of the rehabilitation clinic of the University Clinical Hospital №2 FGAOU VO "First Moscow State Medical University named after I.M. Sechenov", Moscow, Russia.
*Correspondence: Berikhanova Rumisa Ramzanovn (Obstetriciangynecologist, Central Clinical Hospital of Civil Aviation; Applicant, Department of Integrative Medicine, I.M. Sechenov First Moscow State Medical University; Federal State Budgetary Institution “Central Clinical Hospital of Civil Aviation”, Moscow, Russia; E-mail: rumiska07@mail.ru).
Asia-Pacific Journal of Pharmacotherapy & Toxicology 2021, 1: 1-18. https://doi.org/10.32948/ajpt.2021.03.10
Received: 26 Jan 2021 | Accepted: 15 Feb 2021 | Published online: 16 May 2021
Methods The possibilities of non-drug correction (standard approach, physiotherapy, balneotherapy, multivitamins and minerals, physiotherapy) of metabolic and endocrine disorders in 330 women 45-50 years old with metabolic syndrome (MS) during menopause were studied. The participants were divided into 5 groups depending on the programs used, 2 subgroups - mild and moderate menopausal syndrome (MPS). The levels of follicle-stimulating (FSH), luteinizing (LH) hormones, estradiol, hemostasis, glycemic status, lipid profile, green test, blood pressure (BP), SCORE scale were assessed.
Results In patients with mild MPS, when using programs with physiotherapy, HOMA-IR decreased by 50%, the atherogenic index by more than 25.0%, INR increased by more than 4,0%, the Green score decreased by more than 40.0%, the risk on a SCORE scale became <3%. In patients with moderate MPS, the treatment complex with the simultaneous use of vibrotherapy, chromotherapy, melootherapy, aromatherapy and aeroionotherapy had the advantage: HOMA-IR decreased by 50.5%, atherogenic index by 30,5%, INR increased by 5.0%, the Green score decreased by 40.0%, the risk on a SCORE scale became <3%.
Conclusions In patients with MPS and MS, non-drug programs using physical therapy have a positive effect on the functioning of the endocrine system, hemostasis, carbohydrate and fat metabolism which helps reduce the risk of cardiovascular events. In case of moderate MPS against the background of MS, the program with simultaneous use of vibrotherapy, chromotherapy, melotherapy, aromatherapy and aeroionotherapy has an advantage.
Key words Menopausal syndrome, metabolic syndrome, metabolic and endocrine disorders, cardiovascular risk
Materials
The study, approved by the local ethics Committee of the I. M. Sechenov First Moscow State Medical University, meets international ethical requirements and includes 330 women with infored voluntary consent. By randomization, 5 groups were formed, each of which is divided into two subgroups according to the severity of climacteric syndrome (MPS) on the Greene Climacteric Scale (GCS) [25] The scale consists of 21 questions, allowing you to assess emotional-mental (1-11 questions), somatic (from 12 to 18 questions), vasomotor (19 and 20 questions) and sexual (21 questions) disorders. Subgroup A - patients with mild MPS (1-11 points), subgroup B - patients with moderate MPS (12-19 points). Study design reflects Table 1.
The age, social characteristics, and somatic status of the groups did not differ. The characteristics of the clinical groups are presented in Table 2.
All patients gave voluntary informed consent inclusion criteria: women 45-50 years old (average age 47.5±2.5 years), who are in the period of menopausal transition; the presence of initial MS, diagnosed according to the recommendations of experts of the all-Russian scientific society of cardiologists for the diagnosis and treatment of metabolic syndrome (2009) [26], the prescription of MS from two to five years; the presence of mild and moderate MPS, a typical complicated form (against the background of MS); the absence of MGT in the anamnesis; absence of initial disorders of the thyroid gland. Exclusion criteria: whether a woman has: severe mental disorders; alcohol and drug dependence; acute diseases of the cardiovascular system; acute inflammatory diseases; bleeding and propensity to them; malignant or unverified neoplasms; tumors in the growth stage or in a state requiring surgical treatment; signs of severe organ failure; the presence of initially impaired thyroid function according to hormonal examination; the presence of intestinal dysbacteriosis of the 3 degrees of severity; the presence of diabetes mellitus; the presence of vaginitis; individual intolerance to physical factors and / or components of vitamin and mineral products.
Treatment methods
Basic treatment was applied in all groups and included normalization of lifestyle, sleep, diet therapy, and increased physical activity. Treatment principles: personalized approach, timely implementation of events, continuous diet therapy, lifestyle modification (all patients were motivated to quit smoking). In the presence of arterial hypertension, patients received standard antihypertensive therapy (moxonidine 200 mcg orally once a day continuously). It was received by 11 (34.4%) patients of subgroup IA and 13 (46.4%) patients of subgroup IB, 11 (36.7%) patients of subgroup IIA and 14 (48 , 3%) patients of subgroup IIB, 12 (35.3%) patients of subgroup IIIA and 15 (46.9%) patients of subgroup IIIB, 13 (36.1%) patients of subgroup IVA and 16 (47.1%) patients of subgroup IVB, 14 (36.8%) patients in the VA subgroup and 17 (46.0%) patients in the VB subgroup. The groups did not differ significantly in the number of women taking moxonidine.
Basic treatment. Reduction diet based on individual calculation of the main exchange: OO = (0.0342 × M + 3.5377) × 240, where OO - the value of the main exchange (kcal), M - body weight (kg). It was recommended to take a fractional meal 5-6 times a day in small portions at the same time. The diet included foods containing complex carbohydrates (cereals, fruits, vegetables), rich in dietary fiber, restricted the use of simple carbohydrates, saturated fat, salt up to 3 g per day, was not allowed to take coffee, alcohol.
The body mass index (BMI) was calculated using the formula: BMI= body weight (kg) / body length2 (m2). Food diaries were analyzed. The total energy value of the diet was calculated based on standard caloric coefficients in kcal per 1 gram: 4 kcal for protein and carbohydrates, 7 kcal for alcohol and 9 kcal for fat. The waist circumference (CW) was measured.
Physical activity was recommended taking into account the state of health, were in the zone of good tolerance. Used daily walking in the fresh air for 30 minutes. All the patients were motivated to quit smoking, observe the work and rest regime. Basic treatment was carried out in a continuous mode.
Drinking balneotherapy. Ingestion of mineral water "Essentuki № 4" in the volume of 180-300 ml (3 ml per 1 kg of body weight) at room temperature 30 minutes before meals. The course duration was four weeks, followed by a second course in 3 months.
Therapeutic exercise. We used daily morning hygienic gymnastics for 10-15 minutes, pelvic floor exercise (Kegel exercises), aimed at strengthening the periurethral and perivaginal muscles, anal sphincter, and increasing the functional volume of the bladder [27].
Physiotherapy. The multi-factor physiotherapy unit "Spectra Color SPA System" ("Sybaritic Inc.", USA) was used. General vibration therapy: vibration with varying frequency from 10 to 60 Hz and increasing amplitude up to 7 mm, increasing the frequency of vibration for 8-10 seconds, 15 minutes. Music therapy: relaxing melodies within 30 minutes. Aromatherapy: through a four-channel system, aromatic oils were sprayed inside the capsule: Lavandula officinalis, Foeniculum vulgare. Full-spectrum chromotherapy was performed for 30 minutes, with a wavelength from 760 to 400 nm. Selective chromotherapy: green light was applied for 30 minutes, with a wavelength of 530 nm. The face was blown with ionized cool air with a predominance of negative ions for 30 minutes. Inside the capsule, a special individual comfortable microclimate was created. Temperature range 25-30 °C. The contour bed with supporting pads allowed the patient to take the most comfortable and relaxing position. Sessions in the physical therapy facility "Spectra Color SPA System" were held twice a week for 30 minutes, a course of 10 sessions. Repeat the course in 3 months. A total of 20 procedures during observation.
Vitamins and minerals
22 balanced components ("Menopace ® ", " Vitabiotics Ltd.", Great Britain) and calcium carbonate with colecalciferol (vitamin D3) (Calcium-D3 Nycomed, Nycomed Pharma, Norway). Menopace ® " was taken daily 1 capsule per day during or after meals. The course of treatment is 6 months. "Calcium-D3 nicomed", containing calcium carbonate 1250 mg (equivalent to elementary calcium-500 mg) and colecalciferol (vitamin D3) 5 mcg (200 IU), was taken orally 1 tablet 2 times a day for 1 month, repeated course in 3 months.
Survey methods
A general clinical study was carried out: collection of anamnesis, complaints, general examination, measurement of blood pressure (BP), gynecological examination, (examination of the external genital organs, vaginal examination in the mirrors, bimanual vaginal-abdominal examination), general blood test, general urine analysis, electrocardiography ( ECG). General blood analysis was performed on a hematological analyzer "CELL - DYN 17002 (Abbott, USA). The levels of follicle-stimulating hormone (FSH) and luteinizing hormone (LH) were determined using the automatic enzyme immunoassay "NexGen" ("ADALTIS", Italy) in blood serum using a set of reagents "Alcor Bio" (Russia). The level of estradiol was studied using ELISA's diagnostic ELISA kits (DRG, Germany). The concentration of fibrinogen, APTT (activated partial thromboplastin time), prothrombin time, and thrombin time in blood plasma was studied on the "ACL 9000" coagulograph ("INSTRUMENTATION LABORATORY", USA) using reagents from the same company, and the INR (International Normalized Ratio) was determined using the formula:
INR = (patient's Prothrombin time) / Normal average prothrombin time)ISI, where ISI (International Sensitivity Index of thromboplastin) is an indicator of the sensitivity of the used thromboplastin, which standardizes it relative to the international standard. Hageman-dependent fibrinolysis was determined (Arkhipov A. G., Eremin G. F., 1985). C-reactive protein (CRP) was determined by the latex immunoturbidimetric method.
A biochemical blood test was performed on an automatic selective biochemical analyzer "Konelab 30" ("Thermo Fisher SCIENTIFIC", Finland) and standard sets of reagents "BioSystems" (Spain), including the determination of glucose, blood lipid spectrum (total cholesterol (ТS), high-density lipoprotein cholesterol (HDL), low-density lipoprotein cholesterol (LDL), triglycerides). The atherogenicity index (AI) was determined:
AI = (ТS-HDL) / HDL; where AI is the atherogenicity index, ТS is total cholesterol (mmol/l), and HDL is high - density lipoproteins (mmol/l).
The concentration of immunoreactive insulin was determined on a microplate reader "Multiscan EX" ("Labsystems", Finland) using reagents from the company " DRG " (USA). To determine insulin resistance, the HOMA-IR (Homeostasis Model Assessment - Insulin Resistance) model was used. The index is calculated using the formula:
HOMA-IR = fasting glucose (mmol/l) x fasting insulin (Mme/l) /22.5 (Matthews D. R., 1985).
The cardiovascular risk was assessed using the SCORE scale: low - less than 1%; medium (moderate) - from 1% to 5%; high - from 5% to 10%; very high - 10% or more (Conroy R.M. and al., 2003) [28, 29].
Statistical analysis
The sample size was not calculated beforehand. Statistical data processing was performed using the application software packages Statistica 10 ("StatSoft Inc", USA) and SAS JMP 11 ("SAS", USA). Comparisons of the two groups on quantitative scales were made based on the nonparametric Mann-Whitney test. Comparing three or more groups on the quantitative scales were based on nonparametric criterion Kruskal-Wallis. To describe quantitative indicators, the average value and standard deviation in the format "M±σ"were used. The analysis of dynamics of indicators in the case of comparison of two periods was performed on the basis of nonparametric Wilcoxon criterion. The level of statistical significance was determined at the error probability level of 0,05.
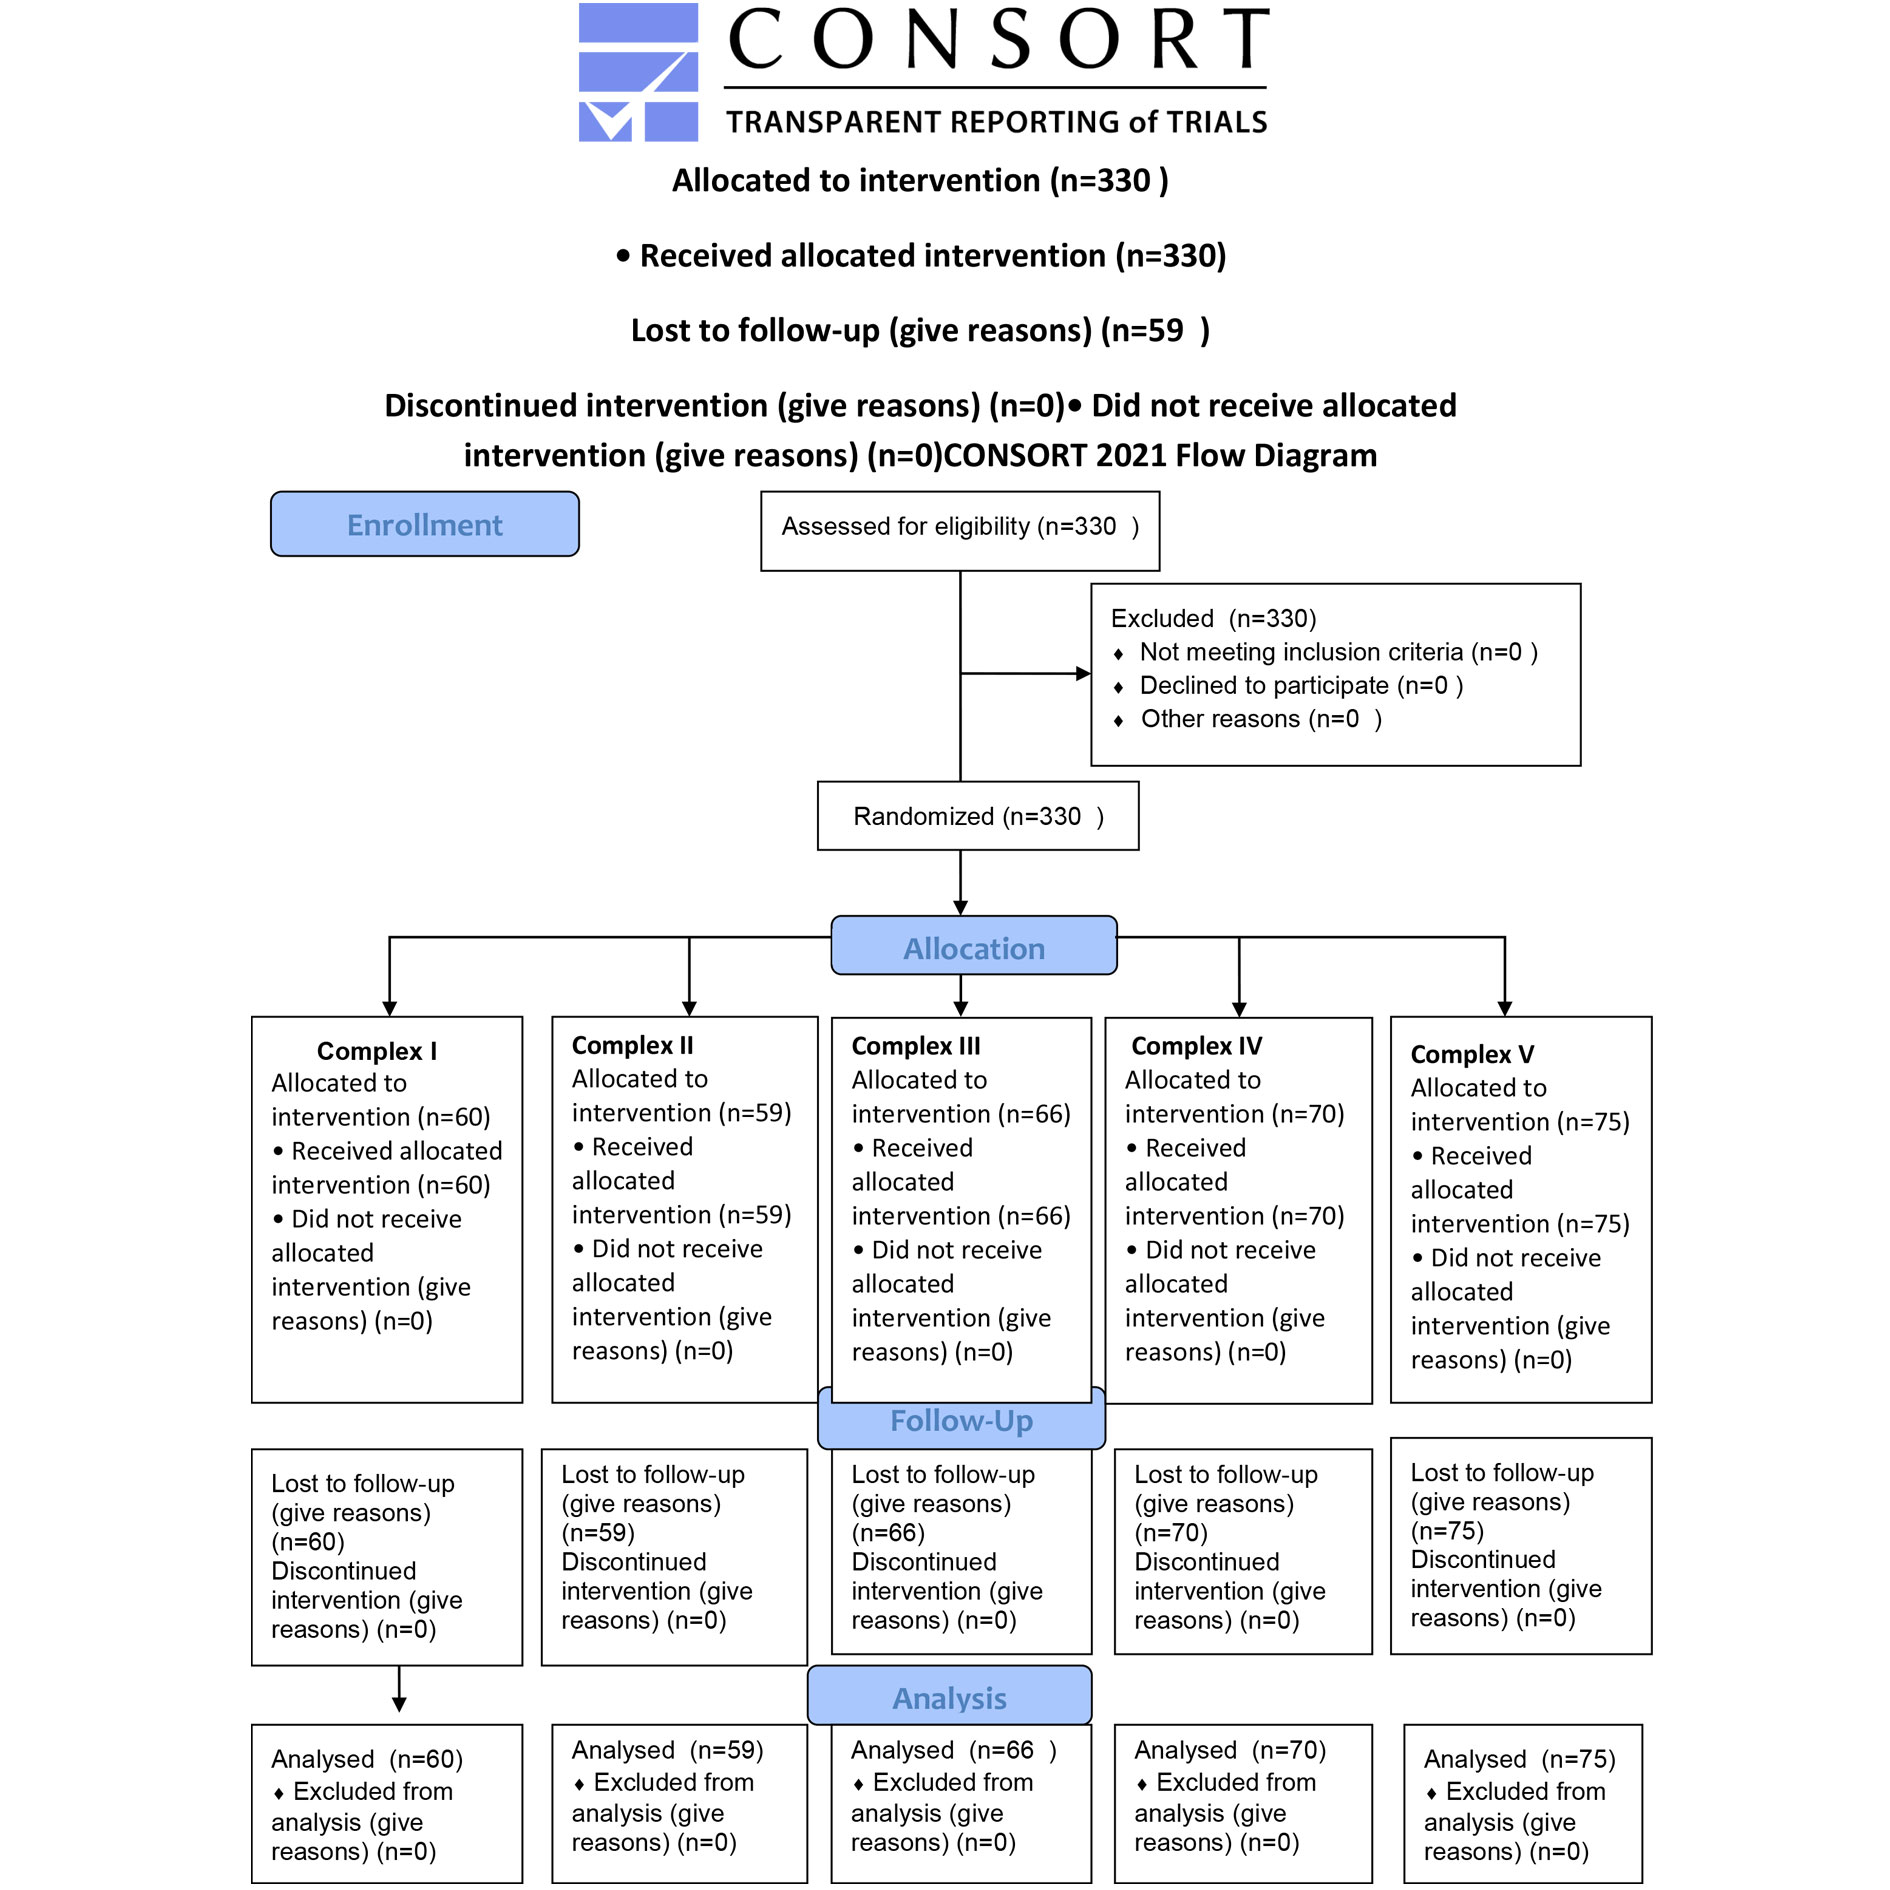 Figure 1. CONSORT 2010 Flow Diagram for the study progress.
|
Table 1. Study design. |
||||||||||
|
Group |
I |
II |
III |
IV |
V |
|||||
|
Sub-group |
IA |
IB |
IIA |
IIB |
IIIA |
IIIB |
IVA |
IVB |
VA |
VB |
|
n |
32 |
28 |
30 |
29 |
34 |
32 |
36 |
34 |
38 |
37 |
|
Treatment methods |
Basic treatment; Drinking balneotherapy; Therapeutic exercise; Multivitamins and minerals; Aromatherapy; Ionotherapy; Melotherapy; Vibration therapy; Chromotherapy
|
Basic treatment; Drinking balneotherapy; Therapeutic exercise; Multivitamins and minerals; Aromatherapy; Ionotherapy; Melotherapy; Vibration therapy
|
Basic treatment; Drinking balneotherapy; Therapeutic exercise; Multivitamins and minerals; Aromatherapy; Ionotherapy; Melotherapy; Chromotherapy |
Basic treatment; Drinking balneotherapy; Therapeutic exercise; Multivitamins and minerals |
Basic treatment |
|||||
|
Table 2. The characteristics of the clinical groups. |
|||||||||||
|
Characteristic |
Group I n=60 |
Group II n=59 |
Group III n=66 |
Group IV n=70 |
Group V n=75 |
||||||
|
Educational level of the surveyed |
|||||||||||
|
|
абс. |
% |
абс. |
% |
абс. |
% |
абс. |
% |
абс. |
% |
|
|
Higher |
39 |
65 |
37 |
62.,7 |
43 |
65.2 |
46 |
65.7 |
49 |
65.3 |
|
|
Incomplete higher |
1 |
1.7 |
2 |
3.4 |
2 |
3.0 |
2 |
2.9 |
3 |
4.0 |
|
|
Secondary vocational |
20 |
33.3 |
20 |
33.9 |
21 |
31.8 |
22 |
31.4 |
23 |
30.7 |
|
|
Social status of the surveyed |
|||||||||||
|
Housewives |
9 |
15.0 |
8 |
13.6 |
10 |
15.2 |
12 |
17.1 |
14 |
18.7 |
|
|
Workers |
15 |
25.0 |
16 |
27.1 |
19 |
28.8 |
21 |
30.0 |
23 |
30.7 |
|
|
Employees |
31 |
51.7 |
30 |
50.8 |
32 |
48.5 |
31 |
44.3 |
32 |
42.7 |
|
|
Teachers |
4 |
6.7 |
4 |
6.8 |
3 |
4.5 |
4 |
5.7 |
3 |
4.0 |
|
|
Medical workers |
1 |
1.7 |
1 |
1.7 |
2 |
3.0 |
2 |
2.9 |
3 |
4.0 |
|
|
Family status |
|||||||||||
|
Married |
42 |
70.0 |
44 |
74.6 |
46 |
69.7 |
48 |
68.6 |
50 |
66.7 |
|
|
Unmarried |
4 |
6.7 |
2 |
3.3 |
5 |
7.6 |
6 |
8.6 |
7 |
9.3 |
|
|
Divorced |
12 |
20.0 |
11 |
18.6 |
12 |
18.2 |
14 |
20.0 |
15 |
20.0 |
|
|
Widows |
2 |
3.3 |
2 |
3.3 |
3 |
4.5 |
2 |
2.9 |
3 |
4.0 |
|
|
The structure of extragenital diseases of the examined |
|||||||||||
|
Endocrine system diseases, eating disorders and metabolic disorders |
60 |
100 |
59 |
100 |
66 |
100 |
70 |
100 |
75 |
100 |
|
|
Diseases of the digestive system |
60 |
100 |
59 |
100 |
66 |
100 |
70 |
100 |
75 |
100 |
|
|
Diseases of the circulatory system: -Hypertensive illness 1, 2 degrees -Chronic venous insufficiency |
24
23 |
40.0
38.3 |
25
21 |
42.4
35.6 |
27
25 |
40.9
37.9 |
29
28 |
41.4
40.0 |
31
31 |
41.3
41.3 |
|
|
Diseases of the nervous system |
36 |
60.0 |
35 |
59.3 |
40 |
60.1 |
43 |
61.4 |
46 |
61.3 |
|
|
Diseases of the genitourinary system chronic kidney disease: - Tubulo-interstitial kidney disease and/or urolithiasis - Other diseases of the kidney and ureter |
11
7 |
18.3
11.6 |
10
6 |
16.9
10.2 |
12
8 |
18.2
12.1 |
13
9 |
18.6
12.9 |
13
9 |
16.9
11.7 |
|
|
Respiratory diseases |
20 |
33.3 |
18 |
30.5 |
21 |
31.8 |
23 |
32.9 |
25 |
33.3 |
|
|
Diseases of the musculoskeletal system and connective tissue |
19 |
31.6 |
17 |
28.8 |
22 |
33.3 |
23 |
32.9 |
25 |
33.3 |
|
|
Diseases of the eye and its adnexa |
15 |
25.0 |
16 |
27.1 |
18 |
27.3 |
21 |
30.0 |
23 |
30.7 |
|
|
The structure of gynecological diseases examined |
|||||||||||
|
Chronic inflammation of the uterine appendages |
19 |
31.7 |
18 |
30.5 |
21 |
31.8 |
22 |
31.4 |
24 |
32.0 |
|
|
History of cervical disease |
25 |
41.7 |
25 |
42.4 |
27 |
40.9 |
29 |
41.4 |
31 |
41.3 |
|
|
Ovarian dysfunction |
20 |
33.3 |
19 |
32.2 |
21 |
31.8 |
23 |
32.9 |
25 |
33.3 |
|
|
History of infertility |
5 |
8.3 |
5 |
8.5 |
6 |
9.1 |
6 |
8.7 |
7 |
9.3 |
|
|
History of ectopic pregnancy |
6 |
10.0 |
5 |
8.5 |
6 |
9.1 |
7 |
10.0 |
7 |
9.3 |
|
|
History of ovarian and uterine surgery |
10 |
16.6 |
8 |
13.6 |
9 |
13.6 |
9 |
12.9 |
11 |
14.7 |
|
|
Myoma of the uterus |
34 |
56.7 |
35 |
59.3 |
36 |
54.5 |
38 |
54.3 |
40 |
53.3 |
|
|
Endometriosis |
37 |
61.7 |
36 |
61.0 |
39 |
59.1 |
42 |
60.0 |
44 |
58.7 |
|
|
History of endometrial hyperplastic processes |
32 |
53.5 |
33 |
55.9 |
34 |
51.5 |
37 |
52.9 |
40 |
53.3 |
|
|
Genital prolapse |
36 |
60 |
35 |
59.3 |
39 |
59.1 |
41 |
58.6 |
44 |
58.7 |
|
|
Mastopathy |
55 |
91.7 |
54 |
91.5 |
60 |
91.9 |
65 |
92.9 |
70 |
93.7 |
|
It was found that in women with moderate MPS in the period of early menopausal transition, the levels of FSH and LH were higher, and the level of estradiol was lower compared to the corresponding indicators of women with mild MPS, which indicated more pronounced violations of the hypothalamic-pituitary-ovarian axis. There was a wide range of fluctuations in the levels of the studied hormones.
Among patients with mild MPS, the most significant positive changes in the hormonal background were found when using complexes with physiotherapy (complexes I, II and III), which was expressed in a significant decrease in gonadotropins after 3 months of treatment, a significant increase in estradiol. The FSH level is shown in Table 3.
The level of FSH decreased in patients of subgroup IA after 3 months of therapy by 11.9% (p=0.0183), and after 6 months of treatment by 23.2% (p<0.0001). respectively in subgroup IIA - by 10.7 % (p=0.0208) and 20.3% (p<0.0001), in subgroup IIIA by 10.4% (p=0.0162) and 19.1% (p<0.0001). Significant regression of FSH was also found in the IVA subgroup - by 6.0% (p=0.0227) and 14.0% (p<0.0001). respectively. but there were statistically significant differences with the IA subgroup. In the VA subgroup. the level of FSH did not change significantly. but there was a tendency for it to increase. Among patients with moderate MPS. the most significant decrease in FSH was observed in subgroups IB. IIB and IIIB: in subgroup IB after 3 months by 11.6% (p=0.0237), after 6 months of treatment by 19.3% (p<0.0001), respectively in subgroup IIB by 8.8% (p=0.0222) and 17.6% (p<0.0001), in subgroup IIIB by 8.6% (p=0.0183) and 16.5% (p<0.0001). In subgroup IVB. the level of FSH significantly decreased after 6 months of treatment by 12.0 % (p<0.0001), but was significantly lower compared to the corresponding indicator in subgroup IB. Attention was focused on a significant increase in the level of FSH in the VB subgroup - by 2.6% (p=0.0008).
The LH level is shown in table 4. Significant regression was observed in subgroup IA. after 3 months of treatment by 19.6% (p=0.0109), after 6 months of treatment by 25.6%. in subgroup IIA by 18.4% (p=0.0069) and 25.0% (p<0.0001), in subgroup IIIA by 17.1% (p=0.0127) and 23.0% (p<0.0001). respectively. differences between subgroups were not significant.
In the IVA subgroup. a statistically significant regression of LH was detected after 6 months of treatment - by 11.7% (p<0.0001), but the indicator significantly differed from that of the IA subgroup. It is important to note that in the VA subgroup, the LH level significantly increased by 12.2% (p<0.0001). Among patients with moderate MPS after 3 months of treatment only the IB subgroup showed a significant decrease in the level of LH - by 16.3% (p=0.0181). After 6 months the regression of the LH level in subgroup IB reached 23.9% (p<0.0001), and there was a significant decrease in the indicator in subgroups IIB, IIIB - by 19.4% (p<0.0001), 20.0% (p<0.0001), respectively, and to a lesser extent in subgroup IIIB - by 4.0% (p=0.0404). Attention was drawn to a statistically significant increase in the level of LH in the VB subgroup by 7.4% (p<0.0001).
Table 5 shows the level of estradiol. A significant increase in estradiol was detected after 6 months of treatment in subgroups IA, IIA, IIIA and IVA-by 22.3% (p=0.0084), 18.1% (p=0.0208), 18.3% (p=0.0005) and 11.1% (p=0.0113), respectively.
However, there were no significant differences between these subgroups. There was no significant change in the level of estradiol in the VA subgroup, the indicator significantly differed from the indicator in the IA subgroup.
In patients with moderate MPS. there was an increase in the level of estradiol in subgroups IB. IIB. IIIB and IVB. it was not reliable. There was a decrease in the level of estradiol in the VB subgroup, but it was not statistically significant.
Waist circumference and BMI
CW dynamics is presented in Table 6. In subgroups A the average value of CW was 90.50 ± 2.01 cm, in subgroups B - 91.81 ± 2.00 cm (p = 0.4556). Significant decrease in CW after 3 months of treatment was found in subgroups IA and IIA. CW decreased in the indicated subgroups after 3 months of treatment by 7.2% (p = 0.0109) and 5.2% (p = 0.0181), after 6 months of treatment by 9.2% (p <0.0001) and 7.3% (p <0.0001), respectively. At the same time, the differences between groups I, II and III were not significant. Among patients with moderate CS, the greatest regression of CW was achieved in subgroups IB and IIB: after 3 months of treatment 6.2% (p = 0.0161) and 5.5% (p = 0.0013), after 6 months of treatment 7.1% (p = 0.0014) and 6.4 % (p <0.0001), respectively. Let's note that the indicators in subgroup IB were significantly lower at the control points in comparison with the rest of the groups. The decrease in CW in group V was the smallest and after 6 months of therapy was 5.0% in the VA subgroup (p = 0.0143), in the VB subgroup - 2.1% (p = 0.5121) from the initial level (p <0.05). At the same time, the indicators significantly differed from the other groups.
BMI is shown in Table 7. Initially the average BMI in subgroups A was 36.07±0.89, in subgroups B it was significantly higher - 36.48±0.99 (p=0.0045). In patients with mild MPS BMI regression was 11.8% (p=0.0109) in subgroup IA after 3 months of treatment, 17.0% (p<0.0001) after 6 months of treatment, 11.1% (p=0.0183) and 15.3% (p<0.0001) in subgroup IIA, 9.2% (p=0.0449) and 14.4% (p<0.0001) in subgroup IIIA, 8.2% (p=0.0525) and 12.0 % (p<0.0001) in subgroup IVA. The lowest BMI regression was observed in the VA subgroup: after 3 months of treatment by 4.6% (p=0.1300), after 6 months of treatment by 4.4% (p=0.0723). In patients with moderate MPS BMI reduction was: in subgroup IB after 3 months of treatment 10.2 % (p=0.0136), after 6 months of treatment 15.3% (p<0.0001), respectively, in subgroup IIB - 9.6% (p=0.0129) and 14.6% (p<0.0001), in subgroup IIIB – 9.8% (p=0.0109) and 13.8% (p<0.0001),in subgroup IVB – 9.4% (p=0.0112) and 12.7% (p<0.0001). In the VB subgroup. the decrease in BMI was not significant - by 1.9% (p=0.7304) and 3.6% (p=0.0929), respectively.
Hemostasis
It was found that in patients with moderate MPS. the thrombophilic properties of blood were more pronounced compared to patients with mild MPS, as indicated by lower values of INR. APTT. higher platelet levels, and XIIA -dependent fibrinolysis.
Physiotherapy as part of complex correction programs helped to reduce the prothrombogenic potential of the blood. In patients with mild MPS. the number of platelets (Table 8) significantly decreased after 3 months of treatment in subgroups IA and IIA - by 4.24% (p=0.0048) and 3.83% (p=0.0005), respectively, and after 6 months of treatment there was a significant regression of the indicator in subgroups IA, IIA and IIIA - by 5.41% (p<0.0001), 4.11% (p<0.0001) and 1.79% (p=0.0008), respectively. No significant changes were found in subgroups IVA and VA. Among patients with moderate CS a significant decrease in the number of trombocytes was found after 3 months of treatment only in subgroup IB by 1.23%, and after 6 months of treatment-in subgroups IB and IIB - by 2.17% (p=0.0127) and 1.04% (p=0.0222), respectively. In subgroups IIIB and IVB the indicator did not change significantly. There was a slight increase in the number of platelets in the VB subgroup, but it was not reliable.
A significant increase in the level of INR relative to the baseline was observed in subgroup IA after 3 months of treatment by 4.0 % (p=0.0142), after 6 months of treatment by 5.0% (p=0.0041). In subgroups IIA and IIIA a statistically significant decrease in INR was achieved after 6 months of treatment by 4.0% (p=0.0028) and 4.0% (p=0.0206), respectively. Among patients with moderate MPS a significant increase in INR was recorded only in subgroup IB after 6 months of treatment - by 5.1 % (p=0.0157). In both subgroups of group IV the level of INR increased slightly, but not significantly relative to the baseline. There was also no significant change in the level of INR in both subgroups of group V (Table 9). At the same time the indicators significantly differed from similar indicators in group I.
The dynamics of the APTT level is shown in Table 10. In patients of subgroups IA. IIA and IIIA. APTT significantly increased after 3 months of treatment - by 1.8% (p=0.0183), 1.5% (p=0.0303) and 1.1% (p=0.0231), respectively, after 6 months of treatment - by 3.2% (p<0.0001). 2.7% (p<0.0001) and 2.3% (p<0.0001), the differences between the subgroups were not statistically significant. In the IVA subgroup. the APTT index significantly increased after 6 months of treatment by 0.8% (p=0.0036). Among patients with moderate MPS APTT significantly increased after 3 months of treatment in subgroups IB and IIB by 1.6% (p=0.0271) and 0.9% (p=0.0062), respectively. After 6 months of therapy. there was an increase in APTT in subgroup IB by 3.3 % (p<0.0001), in subgroup IIB by 1.2% (p=0.0002), and in subgroup IIIB by 1.1% (p=0.0063). In subgroup IVB. the level of APTT increased by 0.9% after 3 months of treatment (p=0.0112), but after 6 months the indicator did not significantly differ from the initial one. In both subgroups of group V there were no significant changes in APTT.
Initially there was an inhibition of the activity of the fibrinolytic system in patients with MPS on the background of MS. and more pronounced in patients with moderate MPS compared to patients with mild MPS. The level of XIIA-dependent fibrinolysis is shown in Table 11. After 3 months of treatment the level of XIIA-dependent fibrinolysis significantly decreased in subgroup IA by 13.5% (p=0.0234). After 6 months a statistically significant decrease was observed in subgroups IA, IIA and IIIA: 21.3% (p=0.0001), 14.4% (p=0.0014) and 17.7% (p=0.0019), respectively. It should be noted that the differences between these subgroups were not statistically significant. In the IVA subgroup after 6 months the level of XIIA-dependent fibrinolysis significantly decreased by 9.8% (p=0.0350), but the indicator was significantly higher in comparison with the IA subgroup.
Among subgroups of patients with moderate MPS. the level of XIIA-dependent fibrinolysis significantly decreased after 6 months of treatment in subgroups IB, IIB, IIIB and IVB - by 18.3% (p=0.0470), 16.1% (p=0.0053), 16.5 % (p=0.0014) and 12.8% (p=0.0325),. while no significant differences were found between the subgroups. In both subgroups of group V there was no statistically significant change in the level of XIIA-dependent fibrinolysis.
Significant regression of fibrinogen was recorded after 6 months of treatment in both subgroups of all groups (Table 12).
Markers of inflammation
The most pronounced decrease in fibrinogen levels was observed in subgroups IA. IIA and IIIA, respectively, by 17.1% (p<0.0001), 14.6% (p<0.0001) and 12.2% (p<0.0001), in subgroups IB, IIB and IIIB, respectively, by 16.3% (p<0.0001), 11.6% (p<0.0001) and 11.6% (p<0.0001). When comparing indicators between similar subgroups of groups I, II and III no statistically significant differences were found. In the IVA subgroup the level of fibrinogen significantly decreased after 6 months of treatment by 9.8% (p=0.0005), in the IVB subgroup by 7.1% (p<0.0001). The VA and VB subgroups did not show a statistically convincing decrease in fibrinogen levels. It is noteworthy that the indicators in groups IV and V significantly differed from those in group I. among patients with mild MPS the level of CRP significantly decreased after 6 months of treatment in all groups (Table 13).
The most pronounced regression of CRP was observed after 6 months of treatment in groups I, II and III: in subgroups IA. IIA and IIIA: respectively by 18.2% (p<0.0001), 14.4% (p=0.0014) and 14.2% (p=0.0038), in subgroups IB, IIB and IIIB - by 17.8% (p=0.0008), 16.2% (p=0.0001) and 15.2% (p=0.0048). In the IVA and IVB subgroups there was also a statistically significant decrease in CRP after 6 months of treatment - by 9.2% (p=0.0089) and 9.9% (p=0.0066), respectively, while in these subgroups the level of CRP was significantly higher against the same subgroups of group I. In subgroup VA. the level of CRP significantly decreased by 8.8% (p=0.0455), but it was significantly higher against subgroup IA. In subgroup VB the decrease in CRP was 7.6%, but it was not statistically significant (p=0.1637) and significantly differed from subgroups IB, IIB and IIIB in which physiotherapy was used.
Сarbohydrate and fat metabolism
The dynamics of the HOMA-IR level is shown in Table 14. Regression of the HOMA-IR level in subgroup IA was significant after 3 months of treatment. amounting to 25.0% (p=0.0496), reaching 54.2% (p<0.0001) after 6 months of therapy. After 6 months of treatment. a significant decrease was observed in subgroups IIA, IIIA and IVA: 49.3% (p<0.0001), 49.7% (p<0.0001) and 38.7% (p<0.0001) of the baseline level, respectively. After 6 months of treatment in subgroups A of groups I, II and III (using physical therapy) HOMA-IR returned to normal values. It should be noted that the HOMA-IR index did not differ significantly between these subgroups, but after 6 months of treatment it was significantly higher in subgroup A of group IV (in which physiotherapy was not used) against these groups. HOMA-IR index significantly decreased after 3 months of treatment only in the subgroup IB of 22.9% (p=0.0430), and after 6 months of treatment a statically significant decline was demonstrated together with the subgroup IB subgroup IIB, IIIB and IVB in sub-group IB is 50.5 % (p<0.0001) in subgroup IIB by 36.8% (p<0.0001) in a subgroup IIIB 37.2% (p<0.0001) in subgroup IVB 32.0% (p<0.0001). However, among patients with moderate MPS only in subgroup IB: the HOMA-IR index reached normal values by the sixth month of treatment (2.68±0.20). At the same time the level of HOMA-IR after 6 months of treatment in both subgroups of group V did not significantly change and was significantly higher compared to the other groups.
The study of the lipidogram showed that the regression of the AI occurred due to a decrease in the atherogenic fractions of lipids (mainly triglycerides). The decrease in AI was significant in both subgroups of all study groups after 6 months of treatment (Table 15). However, this indicator decreased most significantly when using therapeutic complexes that include physical therapy: in subgroup IA after 3 months of treatment by 13.6% (p=0.3679). after 6 months of treatment by 31.2% (p<0.0001), respectively in subgroup IIA - by 12.6% (p=0.2480) and 26.5% (p=0.0002), in subgroup IIIA - by 12.7% (p=0.4013) and 28.8% (p<0.0001), differences between subgroups were not reliable. Regression of AI in the IVA subgroup after 3 months of treatment was 10.4% (p=0.1292), after 6 months 22.3% (p=0.0001), in the VA subgroup 7.6% (p=0.2502) and 17.0% (p=0.0007) respectively, while the AI values in the VA subgroup were significantly higher in comparison with the IA. IIA and IIIA subgroups. Among subgroups of women with moderate MPS the most pronounced positive transformation of the lipid profile was observed in subgroup IB, which was expressed in a decrease in IA after 3 months of treatment by 14.7% (p=0.0993), after 6 months of treatment by 30.5% (p<0.0001). The decrease in AI in subgroup IIB was 7.9% and 25.1%, respectively,. in subgroup IIIB 11.3% (p=0.8010) and 27.8% (p=0.0003), in subgroup IVB 6.7% (p=0.9110) and 21.0% (p=0.0010), in subgroup VB it decreased the least significantly - by 4.6% (p=0.7072) and 10.9% (p=0.0327). In subgroup VB AI was significantly higher in comparison points against subgroup IB.
Blood pressure
We found that at baseline SBP (systolic blood pressure) (Table 16) and DBP (diastolic blood pressure) (Table 17) levels were significantly higher in patients with moderate CS compared to patients with mild CS: 161.75 ± 2.99 mm Hg against 146.70 ± 2.69 mm Hg (p <0.0001) and 96.89 ± 2.98 mm Hg against 91.45 ± 2.86 mm Hg (p = 0.0495), respectively. There was a direct relationship between BMI and SBP (r = 0.76; p <0.05), BMI and DBP (r = 0.70; p <0.05). Among patients with mild CS, the levels of SBP and DBP decreased most significantly when using complexes with physiotherapeutic components I, II and III, after 6 months of treatment, reaching normal values: SBP, respectively, by 15.9% (p <0.0001), 15,4% (p <0.0001) and 15.0% (p <0.0001), DBP by 12.8% (p <0.0001), 11.2% (p <0.0001) and 11.3% (p <0.0001). Among patients with moderate CS, the most significant reduction in SBP and DBP required the simultaneous use of vibrotherapy, chromotherapy, melotherapy, aromatherapy, aeroionotherapy (complex I): after 6 months SBP decreased by 21.0% (p <0.0001), and DBP by 12.4% (p <0.0001).
The 10-year risk of fatal cardiovascular disease
Based on the table, the ten-year risk of fatal cardiovascular disease was estimated for the European population at high risk of cardiovascular disease, taking into account parameters such as age, gender, smoking, systolic blood pressure and total cholesterol. The absence of complicated forms of hypertension and impaired renal function in the surveyed allowed the SCORE scale to be used to stratify cardiovascular risk [29]. People without cardiovascular disease with prediabetes do not necessarily have an increased cardiovascular risk, but need to be assessed in the same way as the general population [30].
At baseline, in all subgroups, the average 10-year risk of cardiovascular complications was moderate (3-4%). By influencing the modifiable risk factors, the correction programs made it possible to significantly reduce this indicator in all subgroups. However, he paid attention that in patients with mild CS in subgroups it decreased to low values (less than 3%), while with the use of standard treatment (subgroup) it remained at the average level - 3.18 ± 0.60 (p = 0.0031)). Among patients with moderate CS, only in the subgroup a regression of the risk of cardiovascular complications on the SCORE scale was achieved to the level of low values - 1.76 ± 0.99 (p = 0.0022) (Table 18).
Green's Test
The total score on the green's climacteric scale in dynamics is shown in Table 19. The initial average score in subgroups A was 10.59±1.06 points, in subgroups b 18.55±1.34 points. A strong correlation was found between the HOMA-IR index and the overall score of the green climacteric scale (r=0.86; p<0.005), between BMI and the overall score of the Green climacteric scale (r=0.78; p<0.005). Among patients with mild MPS regression of climacteric symptoms was detected after 3 months of treatment in subgroup IA by 25.5% (p=0.1419), in subgroup IIA by 20.8% (p=0.1324), in subgroup IIIA by 18.6% (p=0.0867), in subgroup IVA by 14.3% (p=0.0737), but it was not reliable. After 6 months of treatment a statistically significant decrease was found in these subgroups by 55.3% (p<0.0001), 44.6% (p<0.0001), 40.4% (p<0.0001) and 28.1% (p=0.0007), respectively. Among patients with moderate MPS the total score of climacteric disorders decreased after 3 months of treatment in subgroup IB by 24.1% (p=0.1219), in subgroup IIB by 10.8% (p=0.22229), in subgroup IIIB by 7.7% (p=0.2203), in subgroup IVB by 4.8% (p=0.1996), but the differences were not significant in comparison with the initial values. After 6 months of treatment the regression rate was 39.9% (p<0.0001), 19.7% (p<0.0001), 14.5% (p<0.0001) and 6.9 % (p=0.0041), respectively. In subgroups IIB. IIIB. and IVB the total score on the green scale was significantly higher compared to subgroup IB. It is important to note a significant increase in climacteric disorders in group V. which was expressed in an increase in the total test score in subgroup VA after 3 months of treatment by 12.6% (p=0.0286), after 6 months of treatment by 17.1% (p=0.0006), and in subgroup VB after 6 months of treatment by 7.6% (p=0.0106).
Against the background of treatment, the endometrium, cervical epithelium, breast tissue were not compromised, which allowed us to state the safety of the programs used. High compliance to treatment was noted.
As recommended by the European Society of Cardiology (ESC) and the European Association for the Study of Diabetes (EASD) (2019), individuals without cardiovascular disease who have pre-DM do not necessarily have an increased cardiovascular risk, but require an assessment of the risk of cardiovascular disease in the same way as the general population [30].
|
Table 3. Dynamics of follicle-stimulating hormone (mMe/ml) levels. |
|||||
|
Subgroup |
M ± S. before |
M ± S. 3 months |
M ± S. 6 months |
P (before - 3 months) |
P (before - 6 months) |
|
IA |
66.92 ± 30.50 |
58.98 ± 31.67 |
51.41 ± 31.78 |
0.0183 |
<0.0001 |
|
IIA |
64.57 ± 30.30 |
57.65 ± 31.84 |
51.43 ± 31.34 |
0.0208 |
<0.0001 |
|
IIIA |
66.88 ± 30.67 |
59.90 ± 32.50 |
54.08 ± 31.29 |
0.0162 |
<0.0001 |
|
IVA |
68.76 ± 30.73 |
64.66 ± 31.28 |
59.15 ± 29.57 |
0.0227 |
<0.0001 |
|
VA |
67.70 ± 30.33 |
68.26 ± 32.70 |
70.26 ± 35.23 |
0.5534 |
0.9273 |
|
IB |
88.80 ± 32.38 |
78.47 ± 31.96 |
71.67 ± 31.69 |
0.0237 |
<0.0001 |
|
IIB |
85.10 ± 33.21 |
77.61 ± 31.32 |
70.12 ± 30.49 |
0.0222 |
<0.0001 |
|
IIIB |
83.55 ± 32.04 |
76.36 ± 30.55 |
69.75 ± 30.51 |
0.0183 |
<0.0001 |
|
IVB |
83.38 ± 31.93 |
80.67 ± 32.73 |
73.39 ± 31.32 |
0.0610 |
<0.0001 |
|
VB |
82.64 ± 31.81 |
83.23 ± 32.47 |
84.82 ± 33.31 |
0.9875 |
0.0008 |
|
Table 4. Dynamics of luteinizing hormone level (mMe/ml). |
|||||
|
Subgroup |
M ± S. before |
M ± S. 3 months |
M ± S. 6 months |
P (before - 3 months) |
P (before - 6 months) |
|
IA |
23.87 ± 5.93 |
19.19 ± 6.71 |
17.76 ± 6.12 |
0.0109 |
<0.0001 |
|
IIA |
23.47 ± 5.49 |
19.15 ± 6.83 |
17.61 ± 6.44 |
0.0069 |
<0.0001 |
|
IIIA |
23.49 ± 6.02 |
19.48 ± 6.75 |
18.10 ± 6.25 |
0.0127 |
<0.0001 |
|
IVA |
24.53 ± 5.92 |
23.39 ± 5.51 |
21.65 ± 5.99 |
0.0525 |
<0.0001 |
|
VA |
24.47 ± 5.72 |
25.39 ± 5.61 |
27.45 ± 4.70 |
0.0938 |
<0.0001 |
|
IB |
29.84 ± 6.01 |
24.97 ± 7.43 |
22.70 ± 8.17 |
0.0181 |
<0.0001 |
|
IIB |
29.04 ± 5.50 |
26.39 ± 7.48 |
23.39 ± 8.33 |
0.1358 |
<0.0001 |
|
IIIB |
28.41 ± 5.75 |
26.41 ± 7.00 |
22.74 ± 8.07 |
0.1054 |
<0.0001 |
|
IVB |
27.97 ± 6.02 |
27.42 ± 6.49 |
26.85 ± 5.39 |
0.2074 |
0.0404 |
|
VB |
28.27 ± 5.58 |
28.71 ± 6.08 |
30.37 ± 5.09 |
0.3613 |
<0.0001 |
|
Table 5. Dynamics of estradiol level (pmol /l). |
|||||
|
Subgroup |
M ± S. before |
M ± S. 3 months |
M ± S. 6 months |
P (before - 3 months) |
P (before - 6 months) |
|
IA |
113.83 ± 53.71 |
126.04 ± 65.67 |
139.17 ± 77.87 |
0.5168 |
0.0084 |
|
IIA |
119.28 ± 54.66 |
125.48 ± 60.31 |
140.86 ± 73.85 |
0.7057 |
0.0208 |
|
IIIA |
114.07 ± 54.65 |
119.33 ± 59.40 |
134.88 ± 73.78 |
0.2401 |
0.0005 |
|
IVA |
112.18 ± 52.94 |
114.19 ± 54.73 |
124.59 ± 64.78 |
0.8110 |
0.0113 |
|
VA |
115.18 ± 55.82 |
115.42 ± 56.26 |
118.69 ± 59.59 |
0.8625 |
0.7394 |
|
IB |
83.88 ± 34.03 |
90.10 ± 41.12 |
93.06 ± 43.79 |
0.7368 |
0.0993 |
|
IIB |
88.55 ± 35.03 |
92.23 ± 38.49 |
94.65 ± 41.14 |
0.5782 |
0.1950 |
|
IIIB |
91.20 ± 36.45 |
94.34 ± 39.50 |
98.25 ± 43.29 |
0.8688 |
0.1786 |
|
IVB |
90.29 ± 34.78 |
92.31 ± 36.92 |
94.66 ± 39.16 |
0.7959 |
0.2759 |
|
VB |
90.76 ± 35.09 |
88.63 ± 32.89 |
88.08 ± 33.16 |
0.4932 |
0.1012 |
|
Table 6. Dynamics of waist circumference (cm). |
|||||
|
Подгруппа |
M ± S. До |
M ± S. 3 мес |
M ± S. 6 мес |
Уровень P (До-3 мес) |
Уровень P (До-6 мес) |
|
IA |
90.75 ± 1.44 |
84.22 ± 0.99 |
82.40 ± 1.54 |
0.0109 |
<0.0001 |
|
IIA |
90.59 ± 2.95 |
85.82 ± 1.28 |
84.00 ± 2.98 |
0.0181 |
<0.0001 |
|
IIIA |
90.18 ± 2.84 |
85.83 ± 4.79 |
85.41 ± 1.78 |
0.0590 |
0.0148 |
|
IVA |
90.69 ± 1.21 |
87.14 ± 1.46 |
85.96 ± 1.86 |
0.0602 |
0.5171 |
|
VA |
90.29 ± 1.63 |
87.18 ± 3.81 |
85.74 ± 1.31 |
0.0529 |
0.0143 |
|
IB |
91.86 ± 2.14 |
86.12 ± 1.58 |
85.32 ± 3.82 |
0.0161 |
0.0014 |
|
IIB |
91.71 ± 1.51 |
86.68 ± 1.50 |
85.88 ± 2.68 |
0.0013 |
<0.0001 |
|
IIIB |
91.38 ± 2.86 |
86.73 ± 3.23 |
86.56 ± 2.18 |
0.0009 |
0.0016 |
|
IVB |
91.76 ± 2.12 |
90.39 ± 2.35 |
89.66 ± 2.63 |
0.2320 |
0.0543 |
|
VB |
92.32 ± 1.38 |
90.38 ± 1.71 |
90.30 ± 1.29 |
0.5170 |
0.5121 |
|
Table 7. Dynamics of body mass index (BMI) . |
|||||
|
Subgroup |
M ± S. Before |
M ± S. 3 months |
M ± S. 6 months |
P Before - 3 months |
P Before – 6 months |
|
IA |
36.15 ± 1.02 |
31.88 ± 1.98 |
29.99 ± 1.78 |
0.0109 |
<0.0001 |
|
IIA |
36.14 ± 0.90 |
32.13 ± 2.28 |
30.61 ± 2.19 |
0.0183 |
<0.0001 |
|
IIIA |
35.99 ± 0.84 |
32.68 ± 2.38 |
30.80 ± 2.39 |
0.0449 |
<0.0001 |
|
IVA |
36.08 ± 0.77 |
33.12 ± 2.28 |
31.75 ± 2.28 |
0.0525 |
<0.0001 |
|
VA |
35.98 ± 0.91 |
34.33 ± 2.55 |
34.39 ± 2.32 |
0.1300 |
0.0723 |
|
IB |
36.45 ± 0.79 |
32.73 ± 1.58 |
30.88 ± 1.66 |
0.0136 |
<0.0001 |
|
IIB |
36.50 ± 1.15 |
32.93 ± 2.14 |
31.17 ± 1.52 |
0.0129 |
<0.0001 |
|
IIIB |
36.46± 0.93 |
32.89 ± 1.80 |
31.42 ± 1.82 |
0.0109 |
<0.0001 |
|
IVB |
36.51± 1.15 |
33.08 ± 2.10 |
31.88 ± 2.61 |
0.0112 |
<0.0001 |
|
VB |
36.48 ± 0.93 |
35.78 ± 1.94 |
35.16 ± 1.97 |
0.7304 |
0.0929 |
|
Table 8. Analysis of the dynamics of the indicator "Platelets. х103/mm3». |
|||||
|
Subgroup |
M ± S. Before |
M ± S. 3 months |
M ± S. 6 months |
P Before - 3 months |
P Before - 6 months |
|
IA |
285.96 ± 2.06 |
273.84 ± 2.27 |
270.50 ± 2.66 |
0.0048 |
<0.0001 |
|
IIA |
284.72 ± 2.66 |
273.82 ± 2.61 |
273.02 ± 2.43 |
0.0005 |
<0.0001 |
|
IIIA |
285.63 ± 2.97 |
284.38 ± 2.57 |
280.49 ± 2.35 |
0.4788 |
0.0008 |
|
IVA |
286.79 ± 2.29 |
284.89 ± 3.00 |
284.24 ± 2.34 |
0.1395 |
0.0762 |
|
VA |
285.13 ± 2.66 |
284.03 ± 2.50 |
284.07 ± 2.66 |
0.7831 |
0.6475 |
|
IB |
286.26 ± 2.61 |
282.75 ± 2.78 |
280.05 ± 2.17 |
0.0207 |
0.0127 |
|
IIB |
287.80 ± 2.24 |
285.39 ± 2.58 |
284.82 ± 2.11 |
0.1118 |
0.0222 |
|
IIIB |
285.01 ± 2.24 |
284.38 ± 2.85 |
284.08 ± 2.18 |
0.9394 |
0.3679 |
|
IVB |
287.08 ± 3.33 |
286.12 ± 2.65 |
284.55 ± 2.74 |
0.7000 |
0.0897 |
|
VB |
285.84 ± 2.76 |
287.74 ± 2.77 |
288.23 ± 2.32 |
0.0327 |
0.0170 |
|
Table 9. Dynamics of INR level (0.84-1.15). |
|||||
|
Subgroup |
M ± S. Before |
M ± S. 3 months |
M ± S. 6 months |
P Before - 3 months |
P Before - 6 months |
|
IA |
1.00 ± 0.02 |
1.04 ± 0.03 |
1.05 ± 0.03 |
0.0142 |
0.0041 |
|
IIA |
0.99 ± 0.03 |
1.01 ± 0.03 |
1.03 ± 0.03 |
0.2883 |
0.0028 |
|
IIIA |
0.99 ± 0.04 |
1.02 ± 0.03 |
1.03 ± 0.04 |
0.2074 |
0.0206 |
|
IVA |
1.01 ± 0.04 |
1.01 ± 0.04 |
1.02 ± 0.03 |
0.8518 |
0.0841 |
|
VA |
0.99 ± 0.03 |
0.97 ± 0.03 |
0.99 ± 0.03 |
0.2642 |
0.9407 |
|
IB |
0.97 ± 0.04 |
1.00 ± 0.03 |
1.02 ± 0.03 |
0.3924 |
0.0157 |
|
IIB |
0.97 ± 0.04 |
0.99 ± 0.03 |
0.99 ± 0.02 |
0.2915 |
0.4382 |
|
IIIB |
0.97 ± 0.02 |
1.01 ± 0.03 |
1.00 ± 0.03 |
0.0580 |
0.1054 |
|
IVB |
0.98 ± 0.02 |
0.99 ± 0.03 |
1.00 ± 0.03 |
0.3787 |
0.3149 |
|
VB |
0.98 ± 0.03 |
0.99 ± 0.04 |
0.98 ± 0.03 |
0.5641 |
0.9384 |
|
Table 10. Dynamics of the level of APTT, sec (24.0-35.0 sec). |
|||||
|
Subgroup |
M ± S. Before |
M ± S. 3 months |
M ± S. 6 months |
P Before - 3 months |
P Before - 6 months |
|
IA |
26.86 ± 0.14 |
27.34 ± 0.13 |
27.71 ± 0.15 |
0.0183 |
<0.0001 |
|
IIA |
26.81 ± 0.17 |
27.21 ± 0.16 |
27.52 ± 0.16 |
0.0303 |
<0.0001 |
|
IIIA |
27.00 ± 0.13 |
27.30 ± 0.17 |
27.62 ± 0.16 |
0.0231 |
<0.0001 |
|
IVA |
27.01 ± 0.12 |
27.04 ± 0.17 |
27.21 ± 0.16 |
0.6729 |
0.0036 |
|
VA |
26.90 ± 0.19 |
26.86 ± 0.15 |
27.02 ± 0.17 |
0.7394 |
0.3967 |
|
IB |
25.11 ± 0.17 |
25.51 ± 0.13 |
25.94 ± 0.13 |
0.0271 |
<0.0001 |
|
IIB |
25.31 ± 0.13 |
25.54 ± 0.14 |
25.60 ± 0.16 |
0.0062 |
0.0002 |
|
IIIB |
25.21 ± 0.18 |
25.30 ± 0.14 |
25.49 ± 0.15 |
0.6501 |
0.0063 |
|
IVB |
25.31 ± 0.18 |
25.54 ± 0.13 |
25.48 ± 0.17 |
0.0112 |
0.1175 |
|
VB |
25.14 ± 0.19 |
25.02 ± 0.15 |
24.99 ± 0.15 |
0.1764 |
0.1898 |
|
Table 11. Dynamics of the level of XIIA-dependent fibrinolysis, min (5-12 min). |
|||||
|
Subgroup |
M ± S. Before |
M ± S. 3 months |
M ± S. 6 months |
P Before - 3 months |
P Before - 6 months |
|
IA |
11.16 ± 0.88 |
9.66 ± 1.21 |
8.78 ± 0.66 |
0.0234 |
0.0001 |
|
IIA |
11.10 ± 0.99 |
10.50 ± 0.78 |
9.50 ± 0.82 |
0.4564 |
0.0014 |
|
IIIA |
11.15 ± 1.21 |
9.94 ± 1.28 |
9.18 ± 1.00 |
0.0743 |
0.0019 |
|
IVA |
11.03 ± 1.03 |
10.61 ± 0.96 |
9.94 ± 1.17 |
0.6486 |
0.0350 |
|
VA |
11.24 ± 0.91 |
10.79 ± 1.02 |
10.61 ± 0.82 |
0.5534 |
0.1516 |
|
IB |
11.27 ± 1.12 |
9.95 ± 1.08 |
9.21 ± 1.07 |
0.3666 |
0.0470 |
|
IIB |
11.21 ± 1.18 |
10.03 ± 0.82 |
9.41 ± 1.15 |
0.1233 |
0.0053 |
|
IIIB |
11.19 ± 1.15 |
10.31 ± 1.03 |
9.34 ± 0.90 |
0.2441 |
0.0014 |
|
IVB |
11.26 ± 0.90 |
10.71 ± 1.06 |
9.82 ± 1.29 |
0.7959 |
0.0325 |
|
VB |
11.14 ± 1.18 |
11.00 ± 0.82 |
10.97 ± 0.96 |
0.7969 |
0.9245 |
|
Table 12. Dynamics of fibrinogen level, g/l (2.0-4.0 g / l). |
|||||
|
Subgroup |
M ± S. Before |
M ± S. 3 months |
M ± S. 6 months |
P Before - 3 months |
P Before - 6 months |
|
IA |
4.08 ± 0.24 |
3.72 ± 0.14 |
3.41 ± 0.15 |
0.1510 |
<0.0001 |
|
IIA |
4.07 ± 0.26 |
3.83 ± 0.16 |
3.53 ± 0.17 |
0.1947 |
<0.0001 |
|
IIIA |
4.05 ± 0.26 |
3.81 ± 0.12 |
3.62 ± 0.16 |
0.2759 |
<0.0001 |
|
IVA |
4.09 ± 0.34 |
3.93 ± 0.14 |
3.73 ± 0.25 |
0.4101 |
0.0005 |
|
VA |
4.08 ± 0.32 |
3.99 ± 0.17 |
3.85 ± 0.21 |
0.7615 |
0.0655 |
|
IB |
4.27 ± 0.28 |
3.84 ± 0.12 |
3.64 ± 0.17 |
0.3417 |
<0.0001 |
|
IIB |
4.25 ± 0.30 |
4.01 ± 0.14 |
3.79 ± 0.14 |
0.2306 |
<0.0001 |
|
IIIB |
4.28 ± 0.29 |
3.94 ± 0.12 |
3.82 ± 0.15 |
0.1644 |
<0.0001 |
|
IVB |
4.24 ± 0.22 |
4.04 ± 0.16 |
3.94± 0.21 |
0.3787 |
<0.0001 |
|
VB |
4.28 ± 0.30 |
4.17 ± 0.14 |
4.08 ± 0.26 |
0.6838 |
0.0591 |
|
Table 13. Dynamics of the level of C-reactive protein, mg / l (0-5. 0 mg/l). |
|||||
|
Subgroup |
M ± S. Before |
M ± S. 3 months |
M ± S. 6 months |
P Before - 3 months |
P Before - 6 months |
|
IA |
4.44 ± 0.42 |
3.88 ± 0.28 |
3.63 ± 0.29 |
0.0713 |
<0.0001 |
|
IIA |
4.38 ± 0.40 |
4.05 ± 0.35 |
3.75 ± 0.36 |
0.3797 |
0.0014 |
|
IIIA |
4.44 ± 0.41 |
4.02 ± 0.33 |
3.81 ± 0.34 |
0.1076 |
0.0038 |
|
IVA |
4.36 ± 0.40 |
4.15 ± 0.37 |
3.96 ± 0.41 |
0.5751 |
0.0089 |
|
VA |
4.41 ± 0.34 |
4.19 ± 0.31 |
4.02 ± 0.39 |
0.2812 |
0.0455 |
|
IB |
4.45 ± 0.50 |
3.89 ± 0.23 |
3.66 ± 0.29 |
0.1953 |
0.0008 |
|
IIB |
4.45 ± 0.47 |
4.05 ± 0.29 |
3.73 ± 0.28 |
0.0912 |
0.0001 |
|
IIIB |
4.46 ± 0.45 |
4.07 ± 0.36 |
3.78 ± 0.41 |
0.2627 |
0.0048 |
|
IVB |
4.44 ± 0.48 |
4.16 ± 0.28 |
4.00 ± 0.39 |
0.2576 |
0.0066 |
|
VB |
4.48 ± 0.46 |
4.30 ± 0.32 |
4.14 ± 0.40 |
0.7753 |
0.1637 |
|
Table 14. Dynamics of the HOMA-IR level (norm <2.7). |
|||||
|
Subgroup |
M ± S. Before |
M ± S. 3 months |
M ± S. 6 months |
P Before - 3 months |
P Before - 6 months |
|
IA |
5.15 ± 0.70 |
3.86 ± 0.76 |
2.36 ± 0.21 |
0.0496 |
<0.0001 |
|
IIA |
4.99 ± 0.79 |
4.01 ± 0.69 |
2.53 ± 0.21 |
0.2883 |
<0.0001 |
|
IIIA |
5.11 ± 0.70 |
4.03 ± 0.86 |
2.57 ± 0.21 |
0.4013 |
<0.0001 |
|
IVA |
5.06 ± 0.77 |
4.43 ± 0.68 |
3.10 ± 0.51 |
0.5264 |
<0.0001 |
|
VA |
4.98 ± 0.64 |
4.58 ± 0.77 |
4.21 ± 1.19 |
0.9992 |
0.2990 |
|
IB |
5.41 ± 0.84 |
4.17 ± 0.68 |
2.68 ± 0.20 |
0.0430 |
<0.0001 |
|
IIB |
5.38 ± 0.57 |
4.65 ± 0.78 |
3.40 ± 0.57 |
0.1635 |
<0.0001 |
|
IIIB |
5.43 ± 0.80 |
4.64 ± 0.69 |
3.41 ± 0.51 |
0.1510 |
<0.0001 |
|
IVB |
5.38 ± 0.79 |
4.87 ± 0.85 |
3.66 ± 0.90 |
0.6749 |
<0.0001 |
|
VB |
5.34 ± 0.61 |
5.04 ± 0.60 |
4.74 ± 0.83 |
0.5166 |
0.2340 |
|
Table 15. Dynamics of the level of the atherogenicity index (<3). |
|||||
|
Subgroup |
M ± S. Before |
M ± S. 3 months |
M ± S. 6 months |
P Before - 3 months |
P Before - 6 months |
|
IA |
3.35 ± 0.59 |
2.90 ± 0.31 |
2.31 ± 0.29 |
0.3679 |
<0.0001 |
|
IIA |
3.43 ± 0.52 |
3.00 ± 0.35 |
2.52 ± 0.32 |
0.2480 |
0.0002 |
|
IIIA |
3.48 ± 0.49 |
3.04 ± 0.37 |
2.47 ± 0.26 |
0.4013 |
<0.0001 |
|
IVA |
3.55 ± 0.44 |
3.18 ± 0.35 |
2.76 ± 0.36 |
0.1292 |
0.0001 |
|
VA |
3.47 ± 0.29 |
3.20 ± 0.29 |
2.88 ± 0.40 |
0.2502 |
0.0007 |
|
IB |
3.35 ± 0.35 |
2.86 ± 0.31 |
2.33 ± 0.17 |
0.0993 |
<0.0001 |
|
IIB |
3.24 ± 0.45 |
2.98 ± 0.33 |
2.43 ± 0.29 |
0.8010 |
0.0003 |
|
IIIB |
3.47 ± 0.51 |
3.08 ± 0.36 |
2.51 ± 0.35 |
0.3679 |
0.0001 |
|
IVB |
3.40 ± 0.41 |
3.17 ± 0.31 |
2.68 ± 0.35 |
0.9110 |
0.0010 |
|
VB |
3.38 ± 0.39 |
3.22 ± 0.35 |
3.01 ± 0.38 |
0.7072 |
0.0327 |
|
Table 16. Dynamics of systolic blood pressure in the examined groups (mm Hg). |
|||||
|
Subgroup |
M ± S. Before |
M ± S. 3 months |
M ± S. 6 months |
P Before - 3 months |
P Before - 6 months |
|
IA |
146,72 ± 2,61 |
130,01 ± 2,66 |
123,47 ± 2,95 |
0,0109 |
<0,0001 |
|
IIA |
147,43 ± 2,69 |
131,60 ± 2,66 |
124,69 ± 3,09 |
0,0208 |
<0,0001 |
|
IIIA |
147,05 ± 2,93 |
133,32 ± 2,77 |
124,93 ± 3,05 |
0,0162 |
<0,0001 |
|
IVA |
145,45 ± 3,47 |
134,96 ± 3,50 |
126,57 ± 3,47 |
0,0144 |
<0,0001 |
|
VA |
146,87 ± 3,73 |
137,57 ± 3,41 |
128,23 ± 2,91 |
0,0160 |
<0,0001 |
|
IB |
163,10 ± 3,10 |
136,52 ± 2,20 |
128,89 ± 2,95 |
0,0181 |
<0,0001 |
|
IIB |
162,10 ± 3,55 |
140,07 ± 2,96 |
128,33 ± 2,44 |
0,0222 |
<0,0001 |
|
IIIB |
161,75 ± 2,96 |
141,46 ± 3,21 |
129,71 ± 2,05 |
0,0183 |
<0,0001 |
|
IVB |
160,58 ± 2,45 |
142,76 ± 3,17 |
132,04 ± 2,47 |
0,0127 |
<0,0001 |
|
VB |
161,21 ± 2,58 |
145,13 ± 3,03 |
135,67 ± 2,59 |
0,0136 |
<0,0001 |
|
Table 17. Dynamics of diastolic blood pressure in the examined groups (mm Hg). |
|||||
|
Subgroup |
M ± S. Before |
M ± S. 3 months |
M ± S. 6 months |
P Before - 3 months |
P Before - 6 months |
|
IA |
92,50 ± 2,90 |
83,55 ± 2,41 |
80,69 ± 2,91 |
0,0019 |
<0,0001 |
|
IIA |
91,33 ± 2,63 |
83,83 ± 2,84 |
81,12 ± 2,77 |
0,0020 |
<0,0001 |
|
IIIA |
91,02 ± 3,09 |
83,20 ± 2,94 |
80,71 ± 2,81 |
0,0033 |
<0,0001 |
|
IVA |
91,22 ± 2,70 |
85,75 ± 2,87 |
82,62 ± 2,54 |
0,0053 |
<0,0001 |
|
VA |
91,16 ± 3,00 |
86,32 ± 2,97 |
84,47 ± 3,03 |
0,0017 |
<0,0001 |
|
IB |
97,12 ± 2,54 |
87,31 ± 3,26 |
85,08 ± 2,37 |
0,0040 |
<0,0001 |
|
IIB |
97,20 ± 3,15 |
90,01± 2,77 |
87,18 ± 3,31 |
0,0053 |
0,0002 |
|
IIIB |
96,26 ± 3,52 |
91,73 ± 2,56 |
87,21 ± 2,94 |
0,1054 |
<0,0001 |
|
IVB |
96,99 ± 2,86 |
92,53 ± 3,19 |
88,16 ± 3,05 |
0,0325 |
<0,0001 |
|
VB |
96,89 ± 2,83 |
93,21 ± 3,17 |
88,27 ± 2,70 |
0,2186 |
<0,0001 |
|
Table 18. 10 -year risk of fatal cardiovascular disease (SCORE). |
|||||
|
Subgroup |
M ± S. Before |
M ± S. 3 months |
M ± S. 6 months |
P Before - 3 months |
P Before - 6 months |
|
IA |
3.78±0,42 |
3.09±0.73 |
1.60±0,80 |
0.0026 |
0.0006 |
|
IIA |
3.80±0.41 |
3.27±0.83 |
1,73±0.94 |
0.0003 |
0.0002 |
|
IIIA |
3.82±0.46 |
3.15±0.82 |
1.94±0.98 |
0.0012 |
0.0001 |
|
IVA |
3.72±0.61 |
3.22±0.86 |
2.28±0.88 |
0.0463 |
0.0358 |
|
VA |
3.76±0.43 |
3,26±0.60 |
3.18±0.60 |
0.0462 |
0.0331 |
|
IB |
3.95±0.23 |
3,39±0.67 |
1.76±0.99 |
0.0031 |
0.0022 |
|
IIB |
3.93±0.26 |
3.48±0.69 |
3.34±0.97 |
0.0007 |
0.0057 |
|
IIIB |
3,91±0.30 |
3.47±0.57 |
3.28±0.77 |
0.0019 |
0.0007 |
|
IVB |
3.91±0.29 |
3.65±0.69 |
3.47±0.61 |
0.0063 |
0.0022 |
|
VB |
3.95±0.22 |
3.78±0.42 |
3.76±0.43 |
0.0005 |
0.0002 |
|
Table 19. Severity of symptoms of climacteric syndrome on the green scale. Points. |
|||||
|
Subgroup |
M ± S. Before |
M ± S. 3 months |
M ± S. 6 months |
P Before - 3 months |
P Before - 6 months |
|
IA |
11.00 ± 1.05 |
8.19 ± 1.16 |
4.91 ± 0.70 |
0.1419 |
<0.0001 |
|
IIA |
10.61 ± 1.10 |
8.40 ± 1.40 |
5.88 ± 0.87 |
0.1324 |
<0.0001 |
|
IIIA |
10.40 ± 1.08 |
8.47 ± 1.14 |
6.20 ± 1.13 |
0.0867 |
<0.0001 |
|
IVA |
10.31 ± 0.99 |
8.83 ± 1.08 |
7.42 ± 1.03 |
0.0737 |
<0.0001 |
|
VA |
10.61 ± 1.09 |
11.95 ± 1.36 |
12.43 ± 1.08 |
0.0286 |
0.0006 |
|
IB |
18.68 ± 1.27 |
14.17 ± 1.22 |
10.96 ± 1.25 |
0.1219 |
<0.0001 |
|
IIB |
18.83 ± 1.49 |
16.80 ± 1.04 |
14.75 ± 1.43 |
0.2229 |
<0.0001 |
|
IIIB |
18.36 ± 1.28 |
16.95 ± 1.53 |
14.86 ± 1.10 |
0.2203 |
<0.0001 |
|
IVB |
18.21 ± 1.39 |
17.34 ± 1.53 |
16.80 ± 1.68 |
0.1996 |
0.0041 |
|
VB |
18.65 ± 1.29 |
19.34 ± 1.19 |
20.07 ± 1.53 |
0.4619 |
0.0106 |
Our study has demonstrated the regulatory benefits of drug-free programs on the level of gonadotropins in women with MS and CS. These results are consistent with recent major research on the role of FSH (rather than estradiol) in obesity, metabolic disorders, bone loss, increased cardiovascular risk, and aging. Acting through high-affinity receptors, FSH is involved in the pathogenesis of dysregulation of adipose tissue function, energy homeostasis, lipid metabolism, and bone metabolism, which accompany menopause in women and aging in both sexes [36]. Also in the work of Jahangiry L. Et al. (2017) it was shown that high FSH levels are associated with a significantly increased risk of cardiovascular diseases compared to other patients [37]. In patients with moderate MPS, optimal correction of metabolic and endocrine disorders required the use of a whole range of synergistic physiotherapy factors (vibrotherapy, chromotherapy, melotherapy, aromatherapy, aeroionotherapy). Taking into account the focus on comorbid pathology and the similarity of pathogenetic mechanisms of MS and MPS, the therapeutic strategy is based on lifestyle modification, which is consistent with current guidelines that position lifestyle change as a top priority measure both for the prevention and treatment of diabetes and cardiovascular disease [30] and for the correction of menopausal disorders [38]. Physical therapy promoted the activation of metabolism by reducing adipose tissue and increasing muscle tissue [39, 40]. Improvement of the studied parameters was favored by the use of drinking balneotherapy due to the coordination of enteroinsular interactions and a decrease in IR [41, 42]. Highly processed foods, high in fat and sugar, not only contribute to weight gain, but are also characterized by a deficiency of vitamins, minerals and trace elements [43].The inclusion of vitamins and minerals in the therapeutic program is based on their antioxidant abilities and their importance in coordinating metabolic processes [44, 45]. It has been shown that autonomic dysfunction is a factor that increases the risk of cardiovascular complications in persons with MS in the direction of its increase [46]. Therefore, the elimination of the characteristic of CS imbalance in the autonomic nervous system seems to us an important point in a comprehensive approach to the supervision of women with CS and MS. Music therapy has made adjustments to the state of the psychoemotional sphere by pulsating stimulation of the auditory receptors, limbic system, metabolism, and normalization of the respiratory and cardiovascular systems [47]. Aromatherapy had anti-stress, anti-inflammatory effects, normalized the activity of the endocrine system by affecting the olfactory sensory system and modulating the activity of the limbic complex, pituitary-adrenal system [48, 49, 50]. Aeroionization harmonized the work of the relationship's nervous system through a neurohumoral mechanism [51, 52]. The inclusion of vibrotherapy in the treatment complex was justified by its ability to improve blood circulation, activate redox processes, and provide anti-inflammatory and analgesic effects by stimulating the receptors with mechanical vibrations [53, 54]. The result of photobiomodulating effects of chromotherapy was the restoration of the balance of sympathetic-parasympathetic relationships, antistress effect [55, 56]. It is important to note that stress is currently regarded as an independent risk factor for atherosclerosis and fatal cardiovascular complications with corresponding metabolic, inflammatory and hemostatic disorders [57, 58].
Тhe study was conducted in accordance with international ethical requirements, WHO (GCP-Good Clinical Pratice rules) and the Helsinki Declaration of the World Medical Association for the conduct of biometric studies in humans. The study protocol was approved by the local ethics committee of the I.M. Sechenov First Moscow State Medical University Moscow (No. 01-13 of 01/23/2013). All patients gave informed voluntary consent to be included in the study.
Funding
Not applicable.
Author contributions
Berikhanova RR: conceptualization, methodology, software, visualization, investigation, observation;
Minenko IA: data curation, writing - preparation of an original project;
Bondarev SA: validation, writing-reviewing and editing.
Competing interests
All authors disclose no competing interests.
- Yazdkhasti M, Negarandeh R, Behboodi Moghadam Z: An empowerment model of Iranian women for the management of menopause: a grounded theory study. Int J Qual Stud Health Well-being 2019, 14(1): 1665958.
- Harris MT: Menopause: The need for a paradigm shift from disease to women’s health PhD thesis. 2013: 472.
- Zając-Gawlak I, Kłapcińska B, Kroemeke A, Pośpiech D, Pelclová J, Přidalová M: Associations of visceral fat area and physical activity levels with the risk of metabolic syndrome in postmenopausal women. Biogerontology 2017, 18(3): 357-366.
- Jayachandran M, Litwiller RD, Lahr BD, Bailey KR, Owen WG, Mulvagh SL, Heit JA, Hodis HN, Harman SM, Miller VM: Alterations in platelet function and cell-derived microvesicles in recently menopausal women: relationship to metabolic syndrome and atherogenic risk. J Cardiovasc Transl Res 2011, 4(6): 811-822.
- Uygur MM, Yoldemir T, Yavuz DG: Thyroid disease in the perimenopause and postmenopause period. Climacteric 2018, 21(6): 542-548.
- Gietka-Czernel M: The thyroid gland in postmenopausal women: physiology and diseases. Prz Menopauzalny 2017, 16(2): 33-37.
- Proietto J: Obesity and weight management at menopause. Aust Fam Physician 2017, 46(6): 368-370.
- Al-Safi ZA, Polotsky AJ: Obesity and menopause. Best Pract Res Clin Obstet Gynaecol 2015, 29(4): 548-553.
- Grandl G, Wolfrum C: Hemostasis, endothelial stress, inflammation, and the metabolic syndrome. Semin Immunopathol 2018, 40(2): 215-224.
- Lizcano F, Guzmán G: Estrogen Deficiency and the Origin of Obesity during Menopause. Biomed Res Int 2014, 2014: 757461.
- Chedraui P, Pérez-López FR: Metabolic syndrome during female midlife: what are the risks? Climacteric 2019, 22(2): 127-132.
- van den Brink W, van Bilsen J, Salic K, Hoevenaars FPM, Verschuren L, Kleemann R, Bouwman J, Ronnett GV, van Ommen B, Wopereis S et al: Current and Future Nutritional Strategies to Modulate Inflammatory Dynamics in Metabolic Disorders. Front Nutr 2019, 6: 129.
- Stolarczyk E: Adipose tissue inflammation in obesity: a metabolic or immune response? Curr Opin Pharmacol 2017, 37: 35-40.
- Saltiel AR, Olefsky JM: Inflammatory mechanisms linking obesity and metabolic disease. J Clin Invest 2017, 127(1): 1-4.
- Grandl G, Wolfrum C: Hemostasis, endothelial stress, inflammation, and the metabolic syndrome. Semin Immunopathol 2018, 40(2): 215-224.
- Wasserman DH, Wang TJ, Brown NJ: The Vasculature in Prediabetes. Circ Res 2018, 122(8): 1135-1150.
- Rochlani Y, Pothineni NV, Kovelamudi S, Mehta JL: Metabolic syndrome: pathophysiology, management and modulation by natural compounds. Ther Adv Cardiovasc Dis 2017, 11(8): 215-225.
- Cengiz H, Kaya C, Suzen Caypinar S, Alay I: The relationship between menopausal symptoms and metabolic syndrome in postmenopausal women. J Obstet Gynaecol 2019, 39(4): 529-533.
- Lee SW, Jo HH, Kim MR, Kwon DJ, You YO, Kim JH: Association between menopausal symptoms and metabolic syndrome in postmenopausal women. Arch Gynecol Obstet 2012, 285(2): 541-548.
- The North American Menopause Society. The 2017 hormone therapy position statement of The North American Menopause Society. Menopause 2018, 25(11): 1362-1387.
- Marjoribanks J, Farquhar C, Roberts H, Lethaby A, Lee J: Long-term hormone therapy for perimenopausal and postmenopausal women. Cochrane Database Syst Rev 2017, 1(1): CD004143.
- McNeil M: Menopausal Hormone Therapy: Understanding Long-term Risks and Benefits. JAMA 2017, 318(10): 911-913.
- Mudhune GH, Armour M, McBride KA: Safety of menopausal hormone therapy in breast cancer survivors older than fifty at diagnosis: A systematic review and meta-analysis. Breast 2019, 47: 43-55.
- Naftolin F, Friedenthal J, Nachtigall R, Nachtigall L: Cardiovascular health and the menopausal woman: the role of estrogen and when to begin and end hormone treatment. F1000Res 2019, 8: 1576.
- Greene JG: Constructing a standard climacteric scale. Maturitas 1998, 29(1): 25-31.
- Recommendations of experts of the All-Russian Scientific Society of Cardiology on the diagnosis and treatment of metabolic syndrome (second revision). Pract Med 2010, 5 (44): 81-101.
- Kegel AH: Sexual functions of the pubococcygeus muscle. West J Surg Obstet Gynecol 1952, 60(10): 521-524.
- Conroy RM, Pyörälä K, Fitzgerald AP, Sans S, Menotti A, De Backer G, De Bacquer D, Ducimetière P, Jousilahti P, Keil U, et al: Estimation of ten-year risk of fatal cardiovascular disease in Europe: the SCORE project. Eur Heart J 2003, 24(11): 987-1003.
- Mach F, Baigent C, Catapano AL, Koskinas KC, Casula M, Badimon L, Chapman MJ, De Backer GG, Delgado V, Ference BA, et al: ESC Scientific Document Group, 2019 ESC/EAS Guidelines for the management of dyslipidaemias: lipid modification to reduce cardiovascular risk: The Task Force for the management of dyslipidaemias of the European Society of Cardiology (ESC) and European Atherosclerosis Society (EAS). Eur Heart J 2020, 41(1): 111-188.
- Cosentino F, Grant PJ, Aboyans V, Bailey CJ, Ceriello A, Delgado V, Federici M, Filippatos G, Grobbee DE, ESC Scientific Document Group, et al: 2019 ESC Guidelines on diabetes, pre-diabetes, and cardiovascular diseases developed in collaboration with the EASD: The Task Force for diabetes, pre-diabetes, and cardiovascular diseases of the European Society of Cardiology (ESC) and the European Association for the Study of Diabetes (EASD). Eur Heart J 2020, 41(2): 255-323.
- Li S, Li ZF, Wu Q, Guo XC, Xu ZH, Li XB, Chen R, Zhou DY, Wang C, Duan Q, et al: A Multicenter, Randomized, Controlled Trial of Electroacupuncture for Perimenopause Women with Mild-Moderate Depression. Biomed Res Int 2018: 5351210.
- Li Y, Zheng H, Zheng Q, Zhao L, Qin E, Wang Y, Zeng Q, Zheng H, Zhao Y, Sun W, et al: Use acupuncture to relieve perimenopausal syndrome: study protocol of a randomized controlled trial. Trials 2014, 15: 198.
- Ye YB, Wang ZL, Zhuo SY, Lu W, Liao HF, Verbruggen M, Fang S, Mai HY, Chen YM, Su YX: Soy germ isoflavones improve menopausal symptoms but have no effect on blood lipids in early postmenopausal Chinese women: a randomized placebo-controlled trial. Menopause 2012, 19(7): 791-798.
- Jia M, Kluwe L, Liu HC, Tang QJ, Liu L, Wang ZZ, Tian LX, Zhao L, Chen YC, Friedrich RE, et al: Efficacy and side-effects of a semi-individualized Chinese herb mixture "Tiáo Gēng Tāng" for menopausal syndrome in China. In Vivo 2015, 29(1): 109-115.
- Chattha R, Nagarathna R, Padmalatha V, Nagendra HR: Effect of yoga on cognitive functions in climacteric syndrome: a randomised control study. BJOG 2008, 115(8): 991-1000.
- Taneja C, Gera S, Kim SM, Iqbal J, Yuen T, Zaidi M: FSH-metabolic circuitry and menopause. J Mol Endocrinol 2019, 63(3): R73-R80.
- Jahangiry L, Farhangi MA, Rezaei F: Framingham risk score for estimation of 10-years of cardiovascular diseases risk in patients with metabolic syndrome. J Health Popul Nutr 2017, 36(1): 36.
- The North American Menopause Society: The 2017 hormone therapy position statement of The North American Menopause Society. Menopause 2018, 25(11): 1362-1387.
- Myers J, Kokkinos P, Nyelin E: Physical Activity, Cardiorespiratory Fitness, and the Metabolic Syndrome. Nutrients 2019, 11(7): 1652.
- Vaccarezza M, Papa V, Milani D, Gonelli A, Secchiero P, Zauli G, Gemmati D, Tisato V: Sex/Gender-Specific Imbalance in CVD: Could Physical Activity Help to Improve Clinical Outcome Targeting CVD Molecular Mechanisms in Women? Int J Mol Sci 2020, 21(4): 1477.
- Naumann J, Biehler D, Lüty T, Sadaghiani C: Prevention and Therapy of Type 2 Diabetes-What Is the Potential of Daily Water Intake and Its Mineral Nutrients? Nutrients 2017, 9(8): 914.
- Toxqui L, Vaquero MP: An Intervention with Mineral Water Decreases Cardiometabolic Risk Biomarkers. A Crossover, Randomised, Controlled Trial with Two Mineral Waters in Moderately Hypercholesterolaemic Adults. Nutrients 2016, 8(7): 400.
- Elmadfa I, Meyer AL: The status of selected micronutrients in the formation of immune function. Endocr Metab Immune Disord Drug Targets 2019, 19 (8): 1100-1115.
- Jamilian M, Sabzevar NK, Asemi Z: The Effect of Magnesium and Vitamin E Co-Supplementation on Glycemic Control and Markers of Cardio-Metabolic Risk in Women with Polycystic Ovary Syndrome: A Randomized, Double-Blind, Placebo-Controlled Trial. Horm Metab Res 2019, 51(2): 100-105.
- Ko SH, Kim HS: Menopause-Associated Lipid Metabolic Disorders and Foods Beneficial for Postmenopausal Women. Nutrients 2020, 12(1): 202.
- Tursynbekova A, Karibaev K, Tokmurziyeva G, Kulzhanov M, Tenenbaum A, Uteuliev E, Sadykov B: Modification of cardiovascular risk with a combination of metabolic syndrome and vegetative nervous dysfunction. Georgian Med News 2019, 286: 61-66.
- Montinari MR, Giardina S, Minelli P, Minelli S: History of Music Therapy and Its Contemporary Applications in Cardiovascular Diseases. South Med J 2018, 111(2): 98-102.
- Roozbeh N, Ghazanfarpour M, Khadivzadeh T, Kargarfard L, Dizavandi FR, Shariati K: Effect of Lavender on Sleep, Sexual Desire, Vasomotor, Psychological and Physical Symptom among Menopausal and Elderly Women: A Systematic Review. J Menopausal Med 2019, 25(2): 88-93.
- Nikjou R, Kazemzadeh R, Asadzadeh F, Fathi R, Mostafazadeh F: The Effect of Lavender Aromatherapy on the Symptoms of Menopause. J Natl Med Assoc 2018, 110(3): 265-269.
- Schneider R, Singer N, Singer T: Medical aromatherapy revisited-Basic mechanisms, critique, and a new development. Hum Psychopharmacol 2019, 34(1): e2683.
- Iwama H: Negative air ions created by water shearing improve erythrocyte deformability and aerobic metabolism. Indoor Air 2004, 14(4): 293-297.
- Chu CH, Chen SR, Wu CH, Cheng YC, Cho YM, Chang YK: The effects of negative air ions on cognitive function: an event-related potential (ERP) study. Int J Biometeorol 2019, 63(10): 1309-1317.
- Schneider R: Effectiveness of myofascial trigger point therapy in chronic back pain patients is considerably increased when combined with a new, integrated, low-frequency shock wave vibrotherapy (Cellconnect Impulse): A two-armed, measurement repeated, randomized, controlled pragmatic trial. J Back Musculoskelet Rehabil 2018, 31(1): 57-64.
- Zago M, Capodaglio P, Ferrario C, Tarabini M, Galli M: Whole-body vibration training in obese subjects: A systematic review. PLoS One 2018, 13(9): e0202866.
- Paragas ED, Ng ATY, Reyes DVL, Reyes GAB: Effects of Chromotherapy on the Cognitive Ability of Older Adults: A Quasi-Experimental Study. Explore (NY) 2019, 15(3): 191-197.
- Azeemi STY, Rafiq HM, Ismail I, Kazmi SR, Azeemi A: The mechanistic basis of chromotherapy: Current knowledge and future perspectives. Complement Ther Med 2019, 46: 217-222.
- Chinnaiyan KM: Role of stress management for cardiovascular disease prevention. Curr Opin Cardiol 2019, 34(5): 531-535.
- Kivimäki M, Steptoe A: Effects of stress on the development and progression of cardiovascular disease. Nat Rev Cardiol 2018, 15(4): 215-229.
Asia-Pacific Journal of Pharmacotherapy & Toxicology
p-ISSN: 2788-6840
e-ISSN: 2788-6859
 Copyright © Asia Pac J Pharmacother Toxicol. This work is licensed under a Creative Commons Attribution-NonCommercial-No Derivatives 4.0 International (CC BY-NC-ND 4.0) License.