Research Article | Open Access
Mapping the knowledge of machine learning in pharmacy: a scientometric analysis in CiteSpace and VOSviewer
Min Bai1, 2, Yajun Shi1, Na Cui1, 2, Yucheng Liao2, Chao Zhao2, Shanshan Cao2, Kexin Sun2, Na Jia2, Jingwen Wang2, Weiliang Ye3, and Yi Ding2
1Department of Pharmacology, Shaanxi University of Traditional Chinese medicine, Xianyang 712046, China.
2Department of Pharmacy, Xijing Hospital, Fourth Military Medical University, Xi’an 710032, China.
3Department of Pharmaceutics, School of Pharmacy, Fourth Military Medical University, Xi’an 710032, China.
Correspondence: Jingwen Wang (Department of Pharmacy, Xijing Hospital, Fourth Military Medical University, Xi’an 710032, China; E-mail: wangjingwen8021@163.com); Weiliang Ye (Department of Pharmaceutics, School of Pharmacy, Fourth Military Medical University, Xi’an 710032, China; E-mail: yaojixue@fmmu.edu.cn) and Yi Ding (Department of Pharmacy, Xijing Hospital, Fourth Military Medical University, Xi’an 710032, China; E-mail: dingyi.007@163.com).
Asia-Pacific Journal of Pharmacotherapy & Toxicology 2022, 2: 1-10.https://doi.org/10.32948/ajpt.2022.12.10
Received: 10 May 2022 | Accepted: 30 Nov 2022 | Published online: 22 Dec 2022
Methods We searched for scientific publications related to the application of machine learning (ML) in pharmacy from 1970 to 2021 in the Web of Science Core Collection (WoSCC) on February 22, 2022. CiteSpace and VOSviewer were used for analyzing key features of the application of ML in pharmacy searches, including annual output, countries, organizations, journals, authors, references, research hotspots, and frontiers.
Results A total of 13677 studies were extracted as published between 1970 and 2021. Our results suggested that increased numbers of researchers paid more attention to ML applications in pharmacy during this period. Research collaboration was close enough between research countries, organizations and authors. The United States was the country of highest production. California System ranked at the first. Journal of Chemical Information and Modeling published the most studies. Schneider G participated in the highest number of studies. Publication “Breiman L, 2001, Mach Learn, V45, P5” was the one with the highest co-citation number. Research hotspots and frontiers included neural network (NN), artificial neural network (ANN) and deep learning (DL).
Conclusion The amount of researches related to ML applications in pharmacy increased from 1990. NN, ANN, and DL were the recent research focuses, therefore more attentions were needed in those research fields.
Key words artificial intelligence, machine learning, deep learning, neural network, pharmacy
So far, a flood of literatures on the ML applications in pharmacy with different focuses have been conducted. A novel neural network is presented for the identification of the functional mechanisms for design optimization [5]. ML models are also established for structurally complex or pharmaceutically relevant molecules, that are potentially able to enable significant accelerations in the simulation of large molecules [6]. Currently, ML is studied most in three main areas, including chemo-informatics, computational genomics and biomedical imaging [7]. However, relevant literatures are numerous and disjointed, with no visual or quantitative analysis. Meanwhile, the lack of systematic review of the overall research causes the ambiguity of the overall situation of this research field. No ML-related bibliometric analysis in pharmacy has been conducted previously. Therefore, summarization and analyzation of the ML application of in the field of pharmacy is urgently needed.
CiteSpace and VOSviewer are commonly used visual knowledge map analysis tools. Using quantitative analysis of patterns in the scientific publications, bibliometric analysis is widely applied for the organization of knowledge structures and exploration of research trends in various research fields [8, 9]. In this study, the literature on the ML application in pharmacy in the recent 50 years (from 1970 to 2021) in Web of Science (WoS) was visualized and analyzed by the knowledge map. CiteSpace and VOSviewer were applied for the analysis of the key features, including annual output, countries, organizations, journals, authors, references and keywords of the ML-related researches. Subsequently, the research hotspots and frontiers of ML-related researches in pharmacy were summarized. Finally, the future research in this field was prospected.
All data were collected from the advanced search in the WoSCC, including Science Citation Index (SCI)-EXPANDED and Social Science Citation Index (SSCI). The search formula was as follow: TS= (artificial intelligence OR deep learning OR machine learning OR neural network) and TS= (medication* OR drug* OR pharm*). The time span was set as “All years (from 1970 to 2021)”. Types of researches were limited to articles and reviews published in English, while the documents type was set as Article. To avoid bias, all data were collected on February 22, 2022. All documents were saved as txt format.
Analysis method
CiteSpace (5.7.R2) and VOSviewer (1.6.16) were used to conduct visual analysis on the research of ML in the direction of medicine, and also to obtain the research knowledge base, research hotspots and cutting-edge changes in this field. Parameters of CiteSpace included: time slicing (1970–2022) years per slice (1), term source (all selection), links (strength: cosine, scope: within slices), selection criteria (50), pruning (pathfinder and pruning slice networks) and visualization (cluster view-static and show merged network). VOSviewer was used for map creation according to the network data, visualization and exploration of the maps, and also the implementation of network visualization analysis. Parameters used in VOSviewer included: counting method (full counting). The maps of visualization network were displayed as nodes and links. Different nodes represented features including countries, organizations, authors, references and keywords. Different links between nodes represented relationships of the collaboration/cooccurrence and co-citations. The color of the nodes and lines indicated various clusters. The circle of nodes indicated centrality. Nodes demonstrated high centrality were considered as the turning points or pivotal points of the research field.
Data analysis
WoSCC-based literature analysis was used for general data research, including annual output, countries, organizations, journals, authors, references and keywords. Followed by that, VOSviewer software was used for the identification of the countries, organizations, journals, authors, references and research cooperation. Finally, CiteSpace software was used to identify research hotspots and frontiers via co-word network analysis of the keywords.
A total number of 13677 publications related to ML application in pharmacy from 1970 to 2021 were extracted. The average annual output was 380 publications. Publications classified as articles (9663) accounted for 70.70% of the total publications. Reviews (1856 publications) accounted for 13.58% of the total publications. The publication distribution was displayed as in Figure 1. Researches related to ML application in pharmacy emerged during 1973 to1990. Only 6 studies were published between 1970 and 1990. Meanwhile, 30 years later in 2020, the annual output was 2072 publications, which represented the largest annal increase in the number of publications. The earliest publication on the ML application in pharmacy indexed in WoS were published in 1973.The annual output ML-related researches demonstrated a significant increase trend between 1990 and 2021. This significant increase of related researches suggests that increased attentions had been attracted in this field globally, and also indicates that ML application in pharmacy would become a continues hotspot of research.
Country and organization distribution
Table 1 lists the top 10 countries and organizations that contributed to ML application in pharmacy studies. In Figure 2A, the countries (30/126, 23.81%) with publication number≥88 (Threshold=88) were subjected to the co-authorship network analysis. Size of the node represented the study numbers of corresponding country or organization. Each country contributed to at least 376 researches related to the ML application in pharmacy. Furthermore, 5 (United States, China, England, Germany and Italy) of these countries contributed to at least 516 researches. Moreover, close research cooperation occurred between several countries, such as between United States and China, England and Germany, and Italy and Spain. Among these countries, the United States contributed to the most researches (n=4119), followed by China (n=1772), England (n=1102), Germany (n=574), and Italy (n=516). As shown in Figure 2B, the organizations (30/8730, 0.34%) with the publication number≥70 (Threshold=0) were subjected to co-authorship network analysis. Every organization participated in a minimum number of 204 ML-related researches. 5 organizations (University of California System, Harvard University, University of London, Chinese Academy of Sciences and University of Texas System) contributed to at least 182 studies. Close cooperation was also found between organizations, such as between Harvard Medical School and the University of Cambridge, Chinese Academy of Sciences and the University of Cambridge, and the University of California-San Francisco and Stanford University. In those organizations, University of California System ranked first by contributing to 429 researches. The following organizations were Harvard University, the University of London, Chinese Academy of Sciences, and the University of Texas System.
Journal distribution
All published ML-related researches extracted in our study were published in 8959 academic journals. Table 2 lists the top 10 journals related to ML studies. In those 10 journals, a total number of 1463 ML-related researches were published, accounted for 12.7% of all studies extracted in this study. Journal of Chemical Information and Modeling published the highest number of researches. It was followed by PLOS ONE, Scientific Reports, BMC Bioinformatics, and Bioinformatics. The strength of link reflected the number of common cited references between two published researches and/or the number of published researches co-authored by researchers. As shown in Figure 3, the journals (30/2428, 1.24%) with the publication number≥49 (T=49) were subjected to citation network map construction.
Author and co-cited Reference distribution
Table 3 lists the top 10 authors and co-cited references of ML-related researches. The links of co-authorship between researchers indicated the number of co-authorships of the researcher with another researcher. Co-cited references were defined as the publication that were jointly cited in another publication [10]. As shown in Figure 4A, the authors (30/46507, 0.06%) with the publication number ≥17 (Threshold=17) were subjected to citation network map analysis. In the results, we found that every author contributed to a minimum number of 39 ML-related researches. Of all the authors, 3 authors: Schneider G, Zhang Y and Ekins S contributed to at least 58 researches. Also, close cooperation was found between authors, including the cooperation between Schneider G and Gonzalez-Diaz H, Ekins S and Schneider G, and Ekins S and Gonzalez-Diaz H. In those authors, Schneider G ranked first due to the highest number of contributed publications (n =77). The following authors were Zhang Y (n=74) and Ekins S (n=58).
In the analysis of co-cited references, we found that the top 10 references were cited by a minimum number of 368 publications. In all the top cited publications, five publications: Breiman L, 2001, Mach Learn, V45, P5; Cortes C, 1995, Mach Learn, V20, P273; Lecun Y, 2015, Nature, V521, P436; Svetnik V, 2003, J Chem Inf Comp Sci, V43, P1947; and Pedregosa F, 2011, J Mach Learn Res, V12, P2825 were cited by at least 410 publications. Publications entitled “Random Forests” by Breiman L [11] in the Journal of Machine Learning, and “Support-Vector Networks” by Cortes C et al. [12] in the Journal of Machine Learning were publications with the highest co-cited number (n=455, n=455). It was followed by publications by Lecun Y et al. ADDINin Nature (n=429), Svetnik V et al. [13] and Pedregosa F et al. [14] in Journal of Machine Learning Research (n=412). As shown in Figure 4B, the references (25/450998, 0.005%) with co-citations≥146 (Threshold=146) were subjected to co-citation map analysis. We found that several references were jointly cited in publications, such as publications by Breiman L, 2001, Mach Learn, V45, P5; Cortes C, 1995, Mach Learn, V20, P273; and Lecun Y, 2015, Nature, V521, P436.
Co-words Analysis of Keyword
Keywords represent the core content and topics of the documents. Keywords potentially represented the research hotspots and frontiers during a certain period of time [10], and provided a sensible descriptions of the hotspots of the researches (attention paid by researchers focusing on related projects) [15]. Keywords with strong burst strength represented the potential hotspots and frontiers in this research field during a certain time period. Table 4 lists the top 20 keywords used in ML-related studies. We found that “QSAR” was the most popular keyword (41.90) by the strength, after removing the “Neural network” (150.81), “Artificial neural network” (69.00), and “Artificial neural network” (58.66). The top 20 keywords with the strongest citation bursts are presented in Figure 5. The term with the highest burst strength was “Neural network” (n = 150.81), which provided important insights and references for the trend and focus of later study.
As shown in Figure 6, keywords with strong burst strength explored by CiteSpace included artificial neural network, neural network, working memory, deep learning, convolutional neural network, descriptor, molecular descriptor, QSAR, QSPR and structure property relationship. NN, ANN, DL, QSAR and support vector machine demonstrated high (N>38) burst strength. Moreover, keywords: “neural network” (2018-2022) and “deep learning” (2019-2022) were published in 2022. Figure 6 illustrates the keyword cluster map of co-words in publications related to ML application in pharmacy. All keywords were categorized to 7 clusters: FMRI, genetic algorithm, drug discovery, genomics, deep learning, etc.
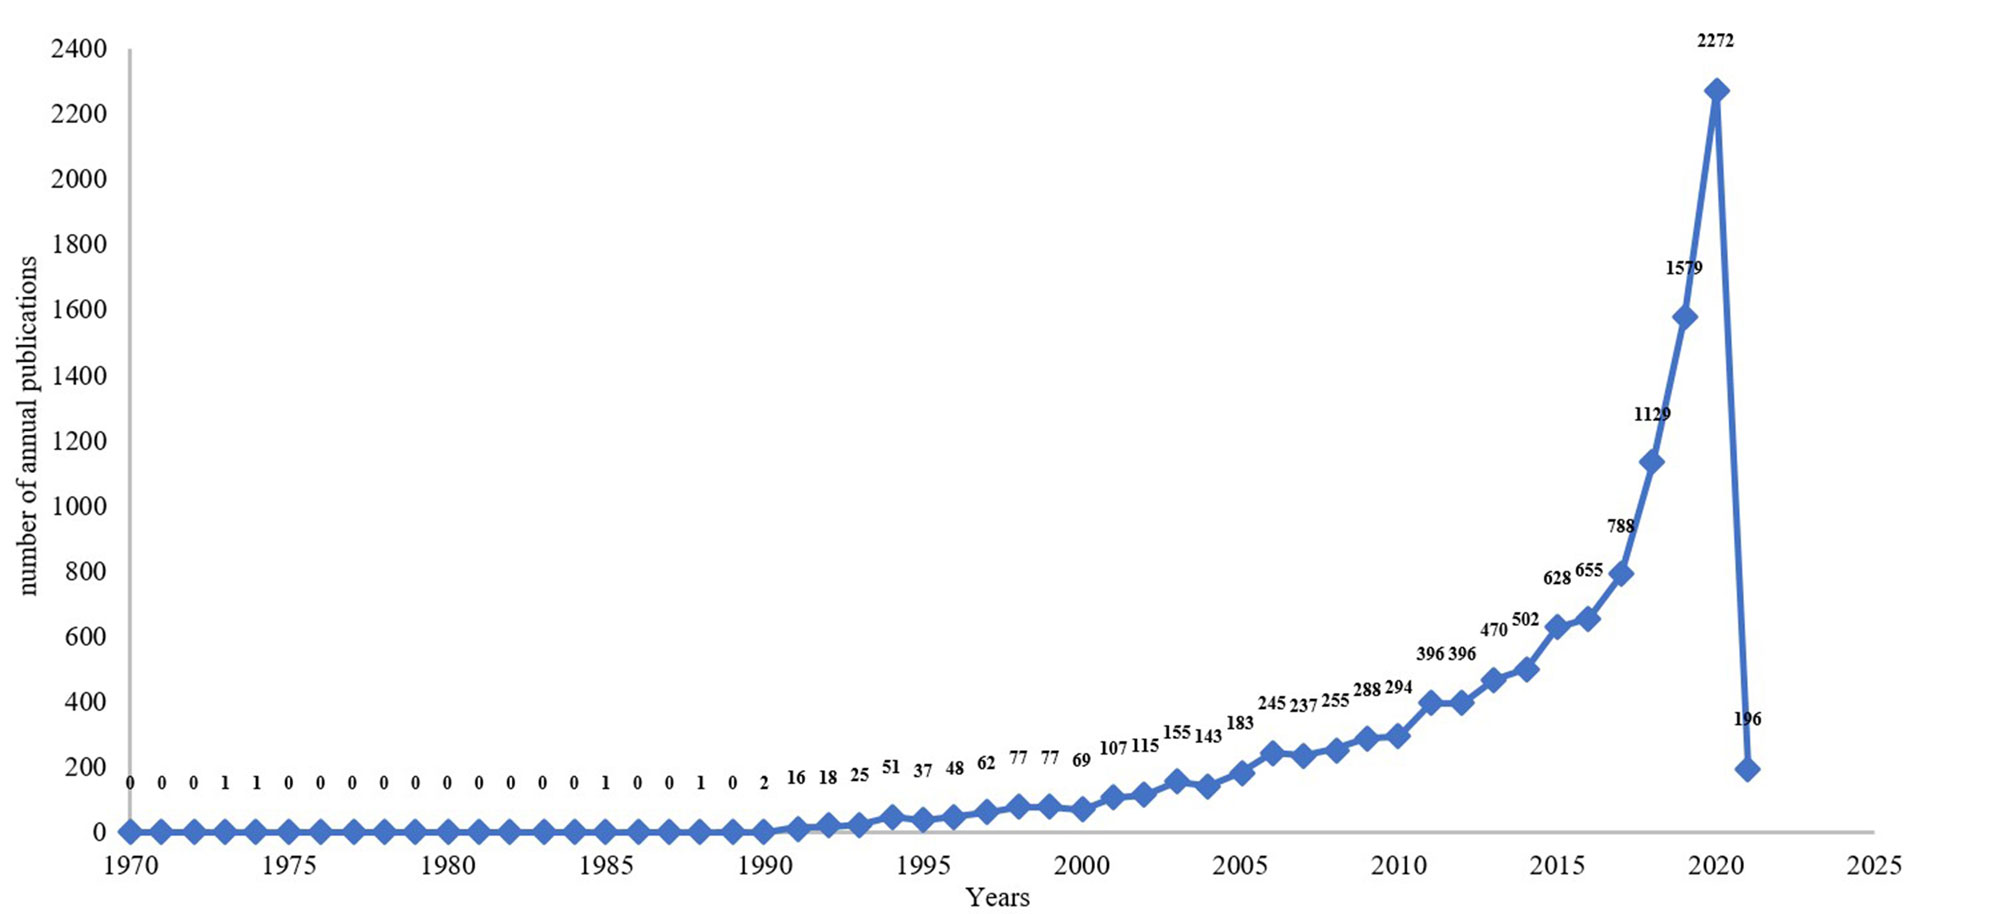 Figure 1. The number of annual publications in the Web of Science and published from 1970 to 2021.
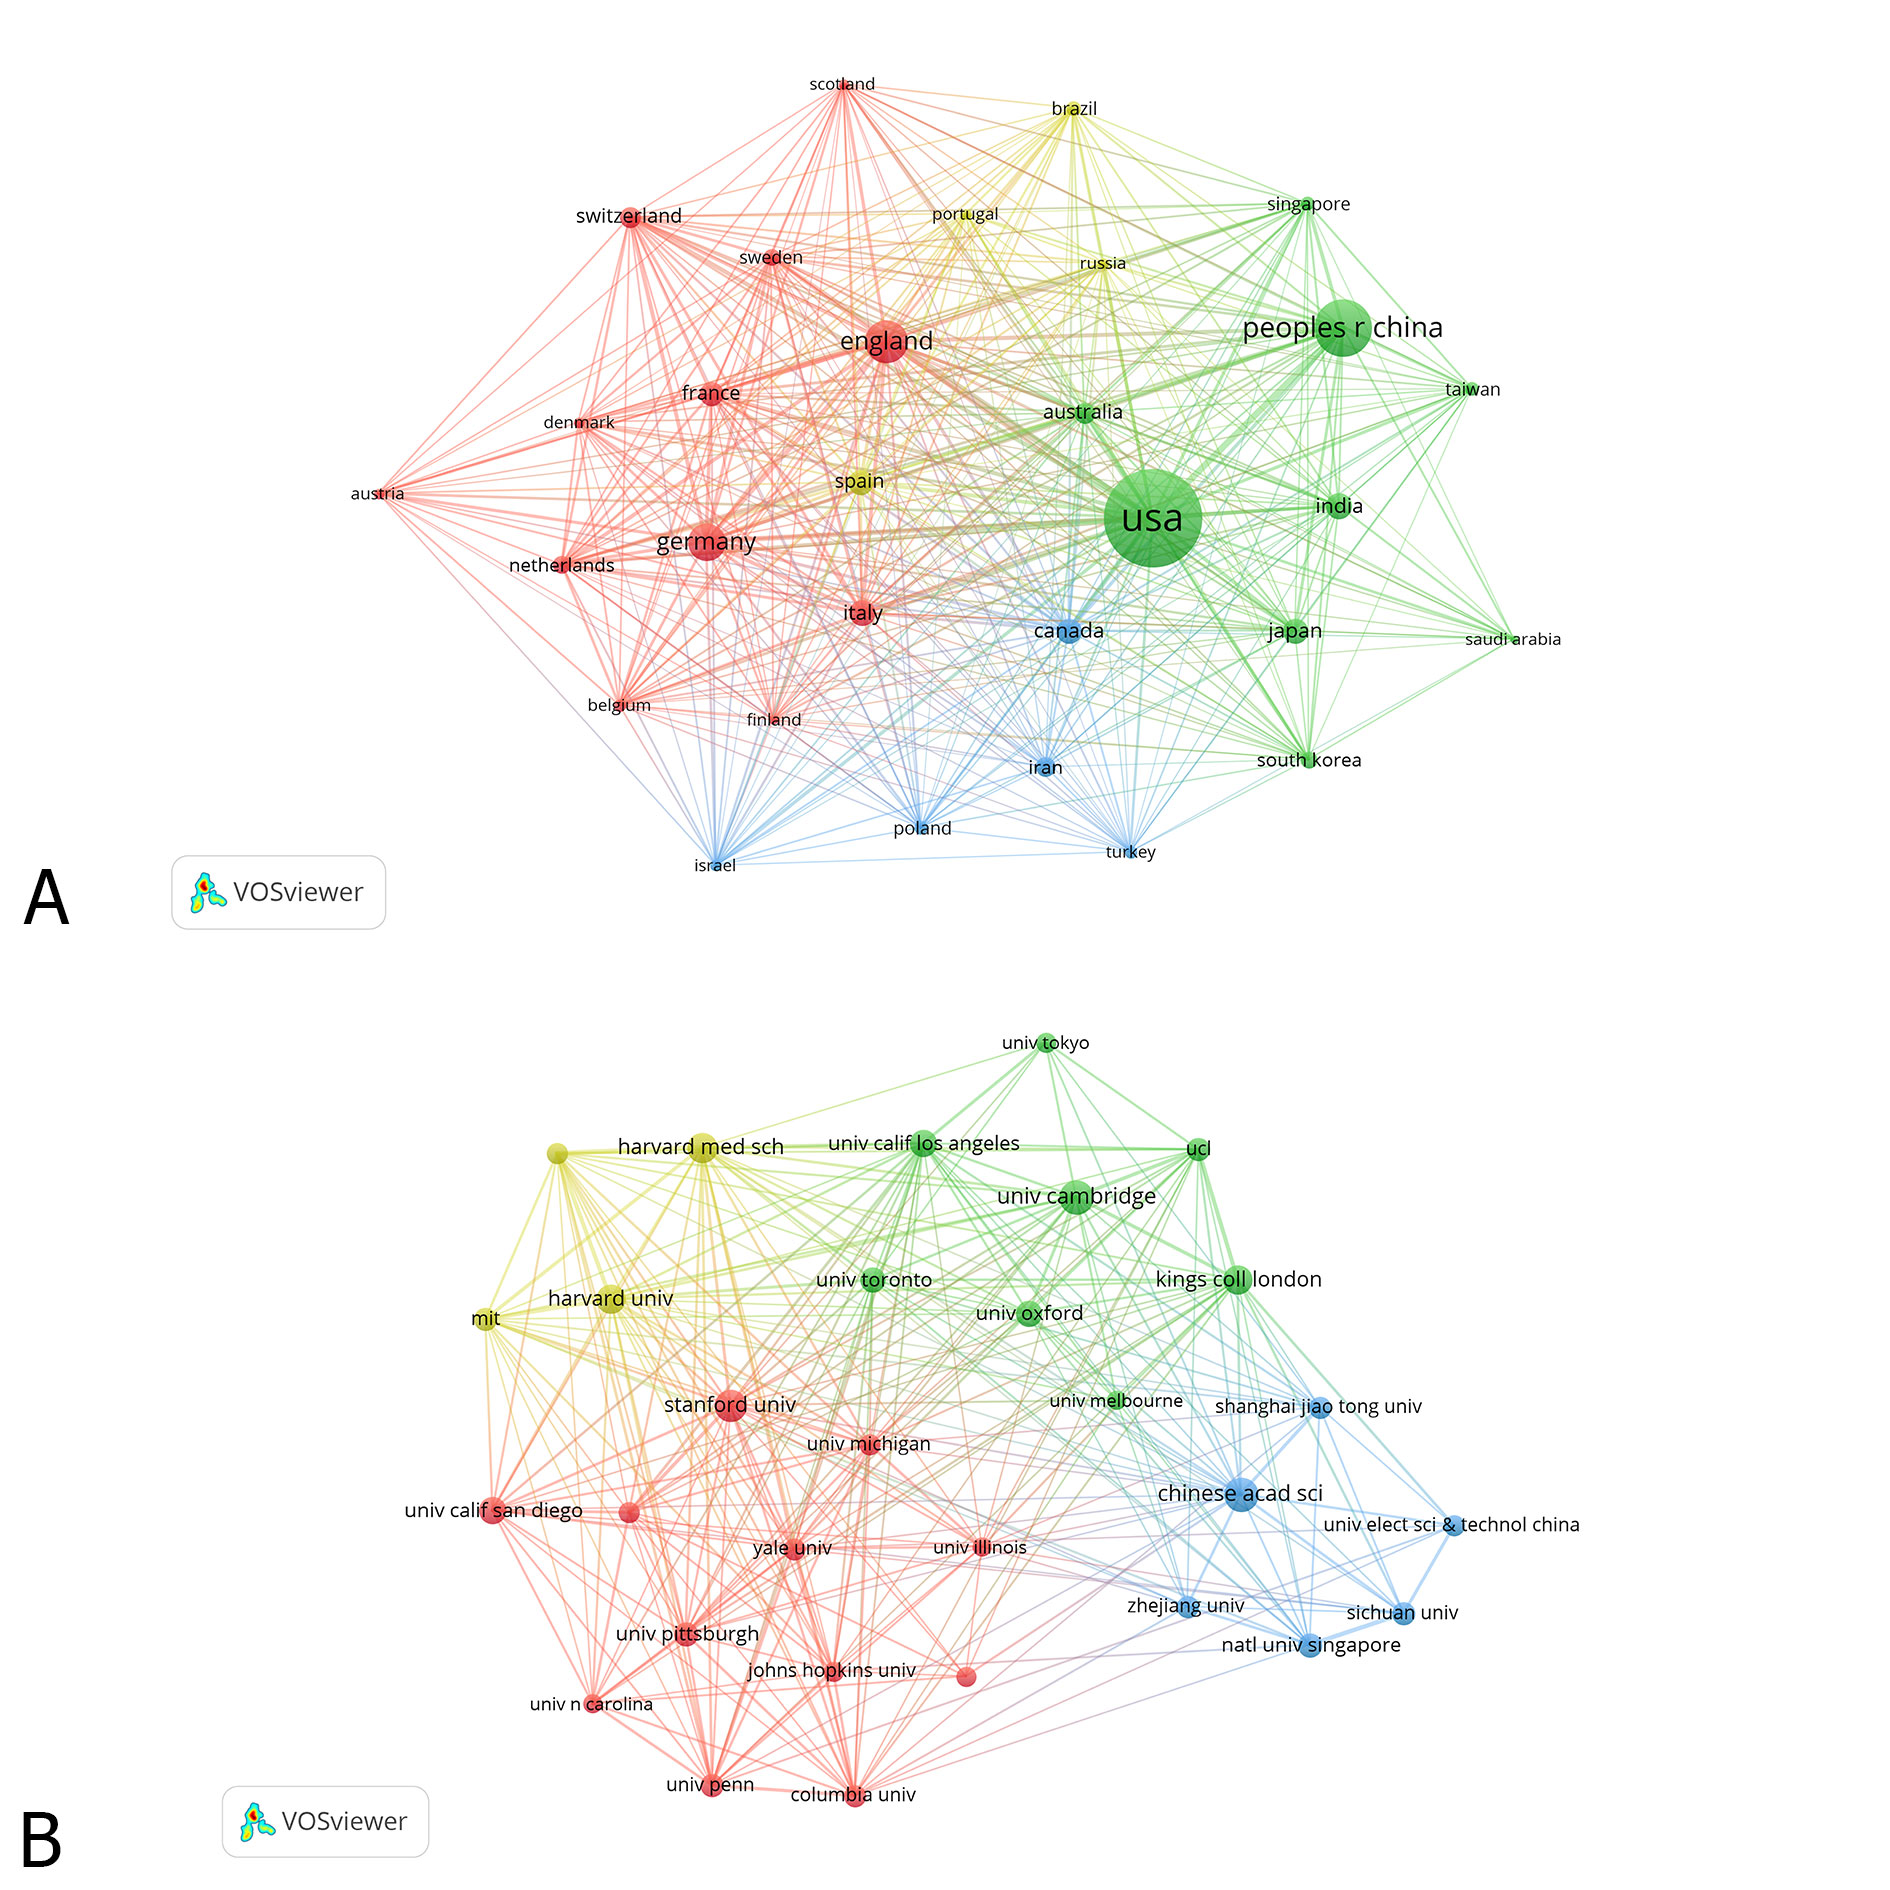 Figure 2. The distribution of countries (A) and organizations (B) participating in ML studies.
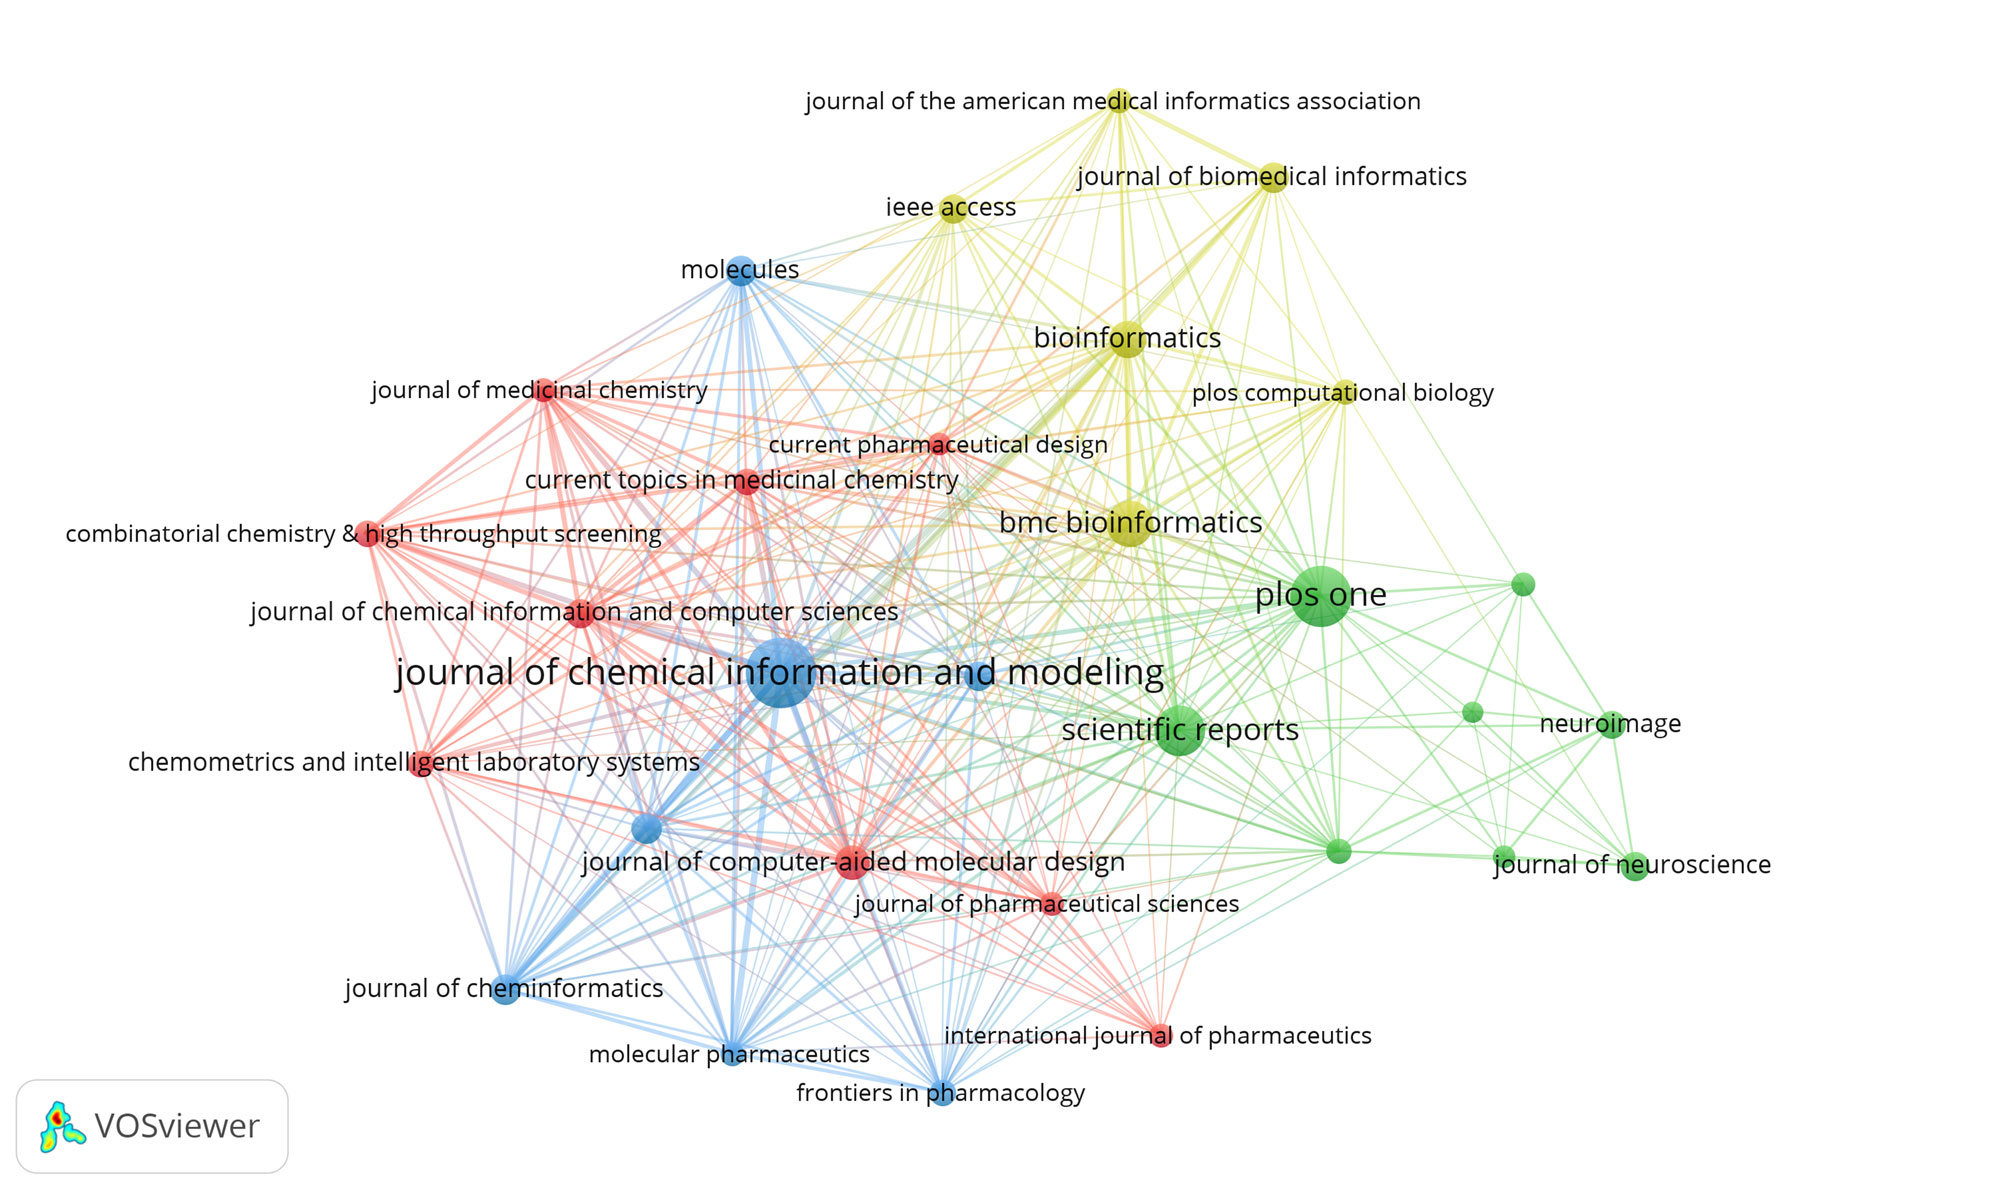 Figure 3. The distribution of journals participating in ML studies.
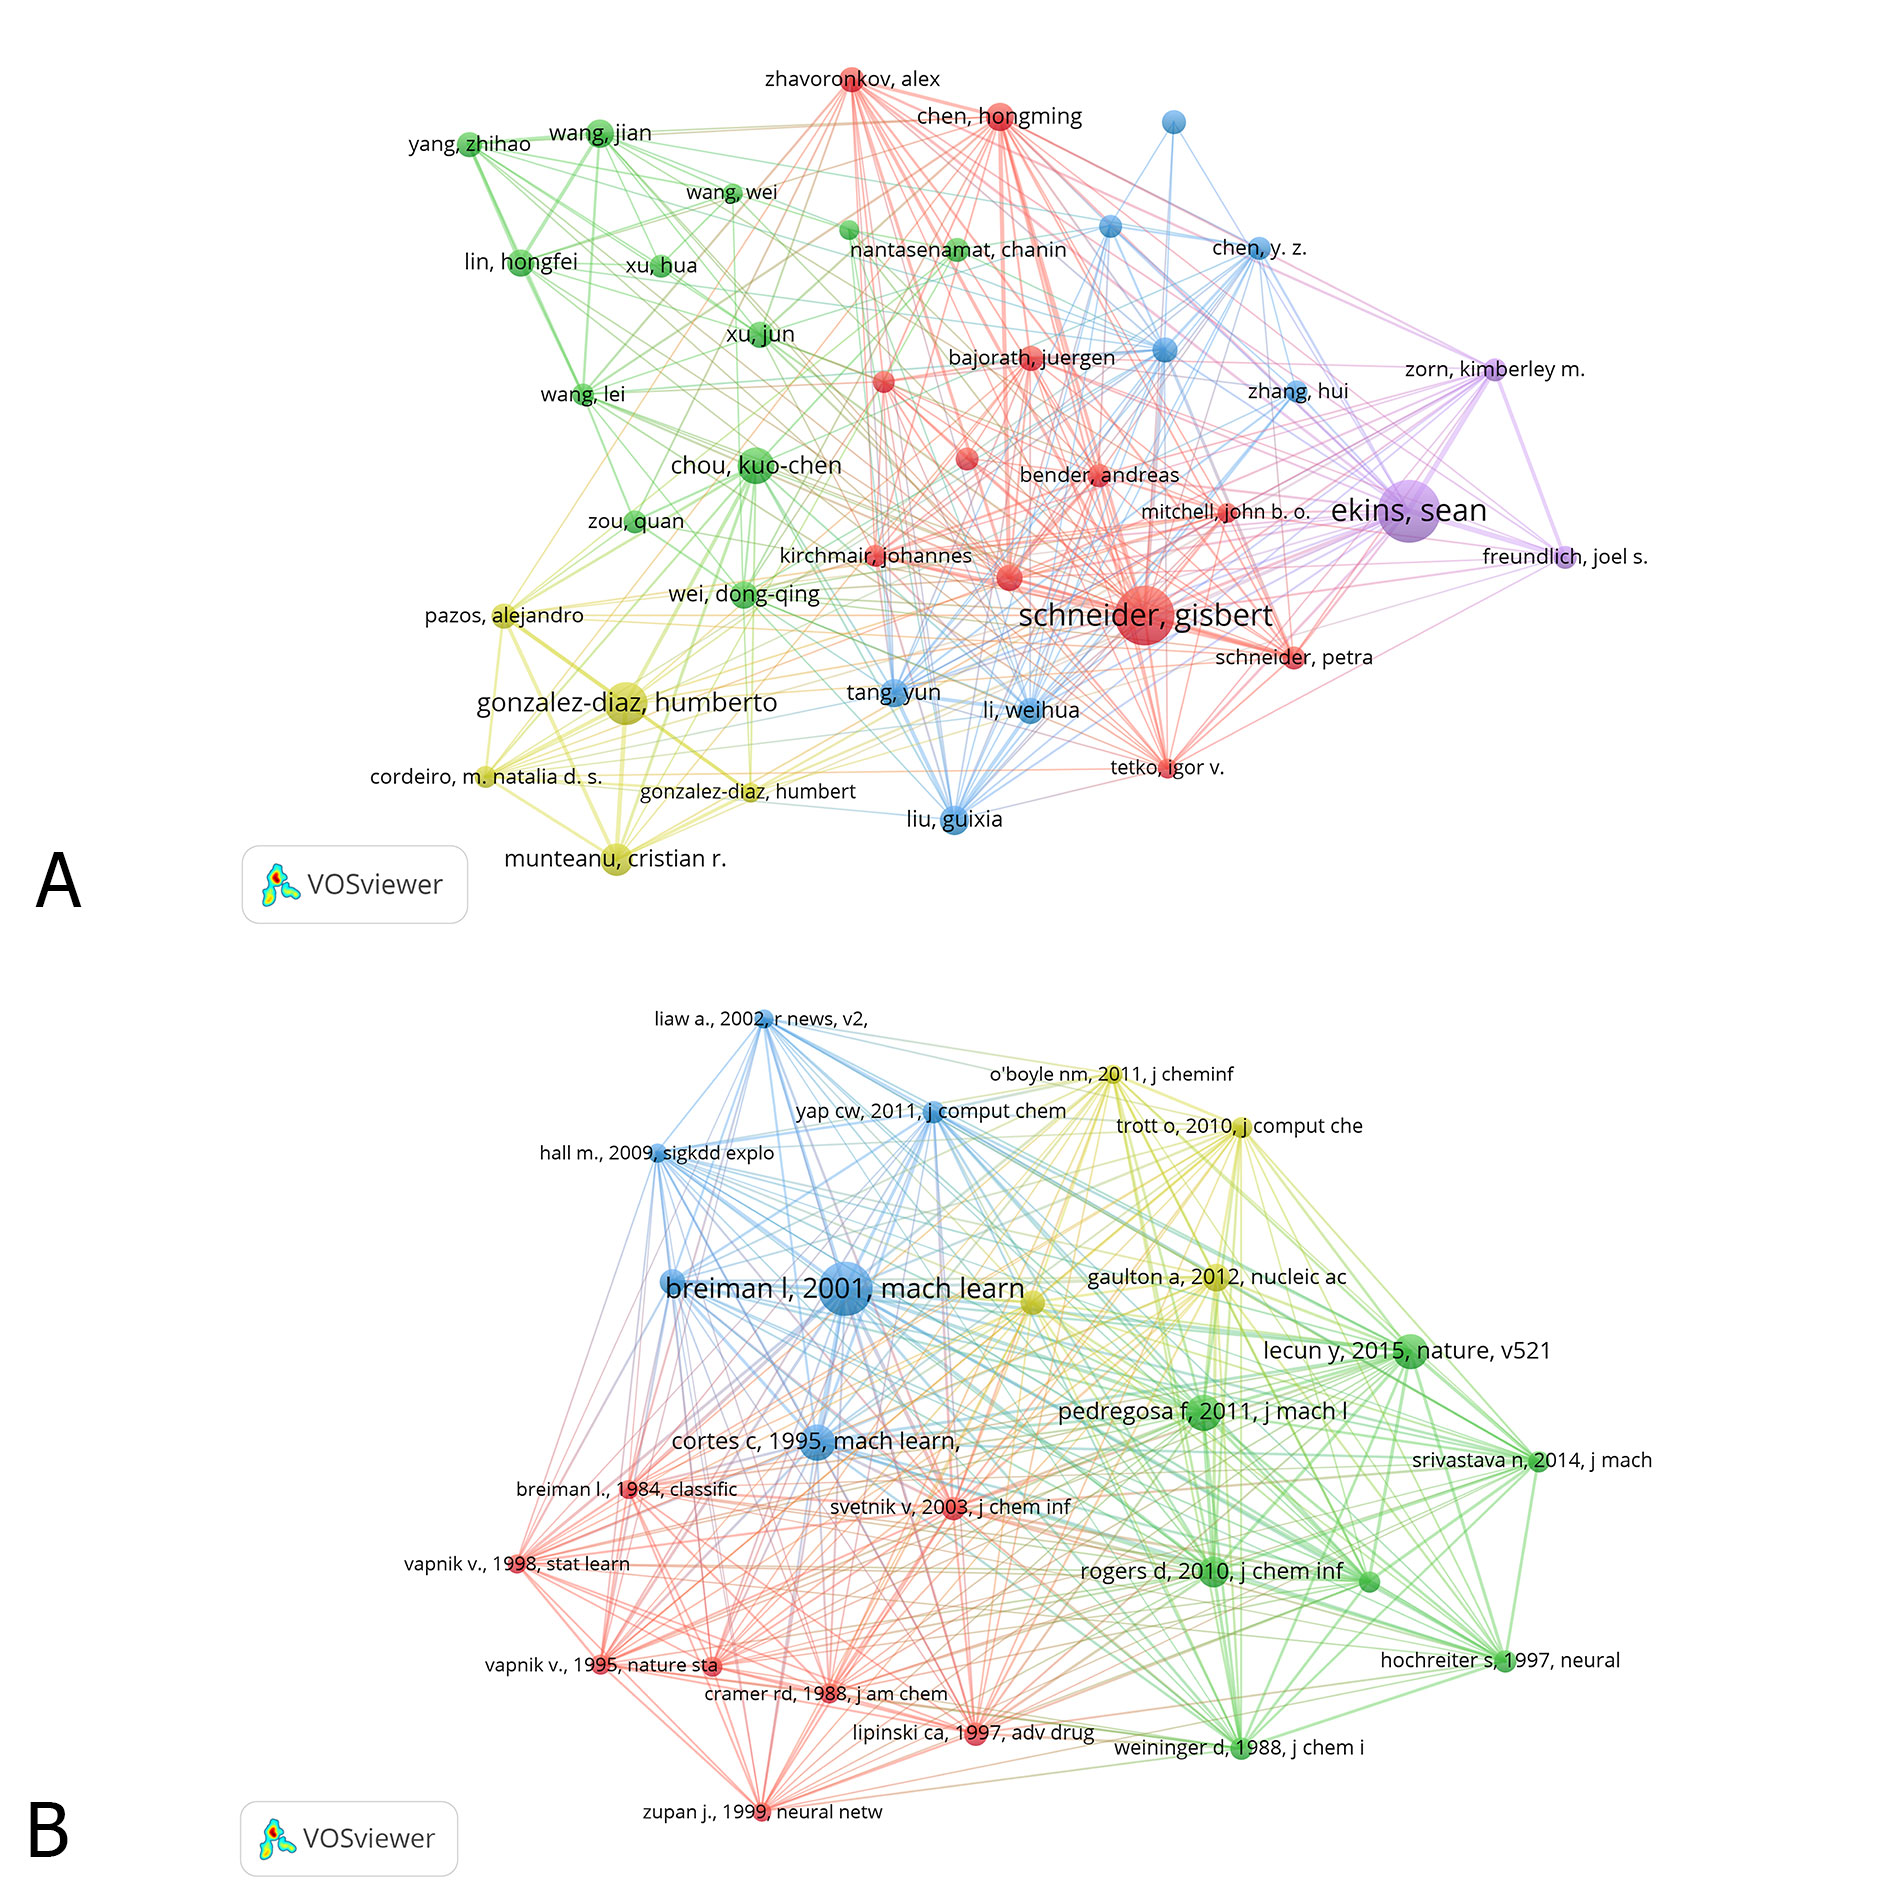 Figure 4. The distribution of authors (A) and Co-cited references (B) participating in ML studies.
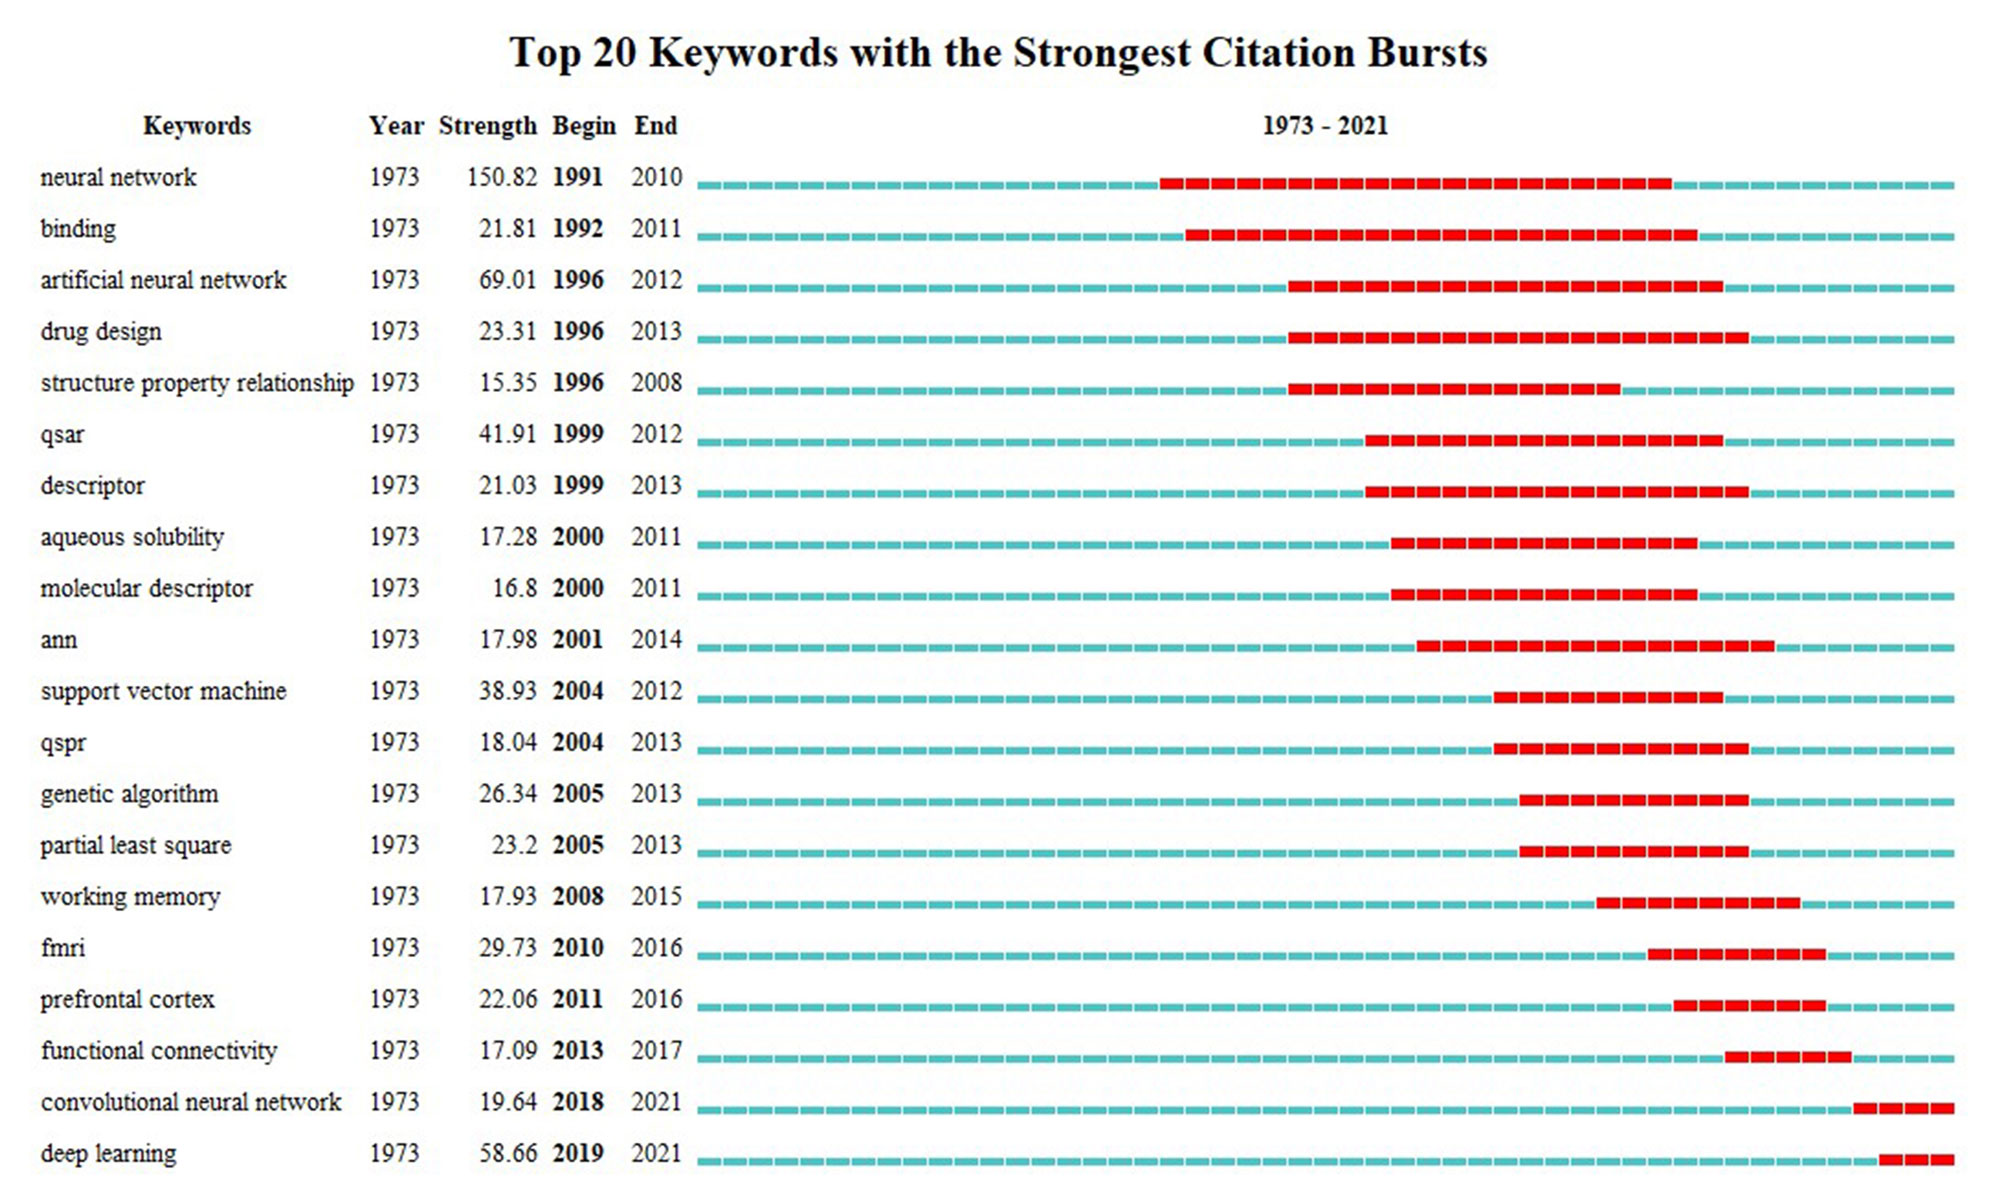 Figure 5. The citation burst of keywords in ML in pharmacy studies.
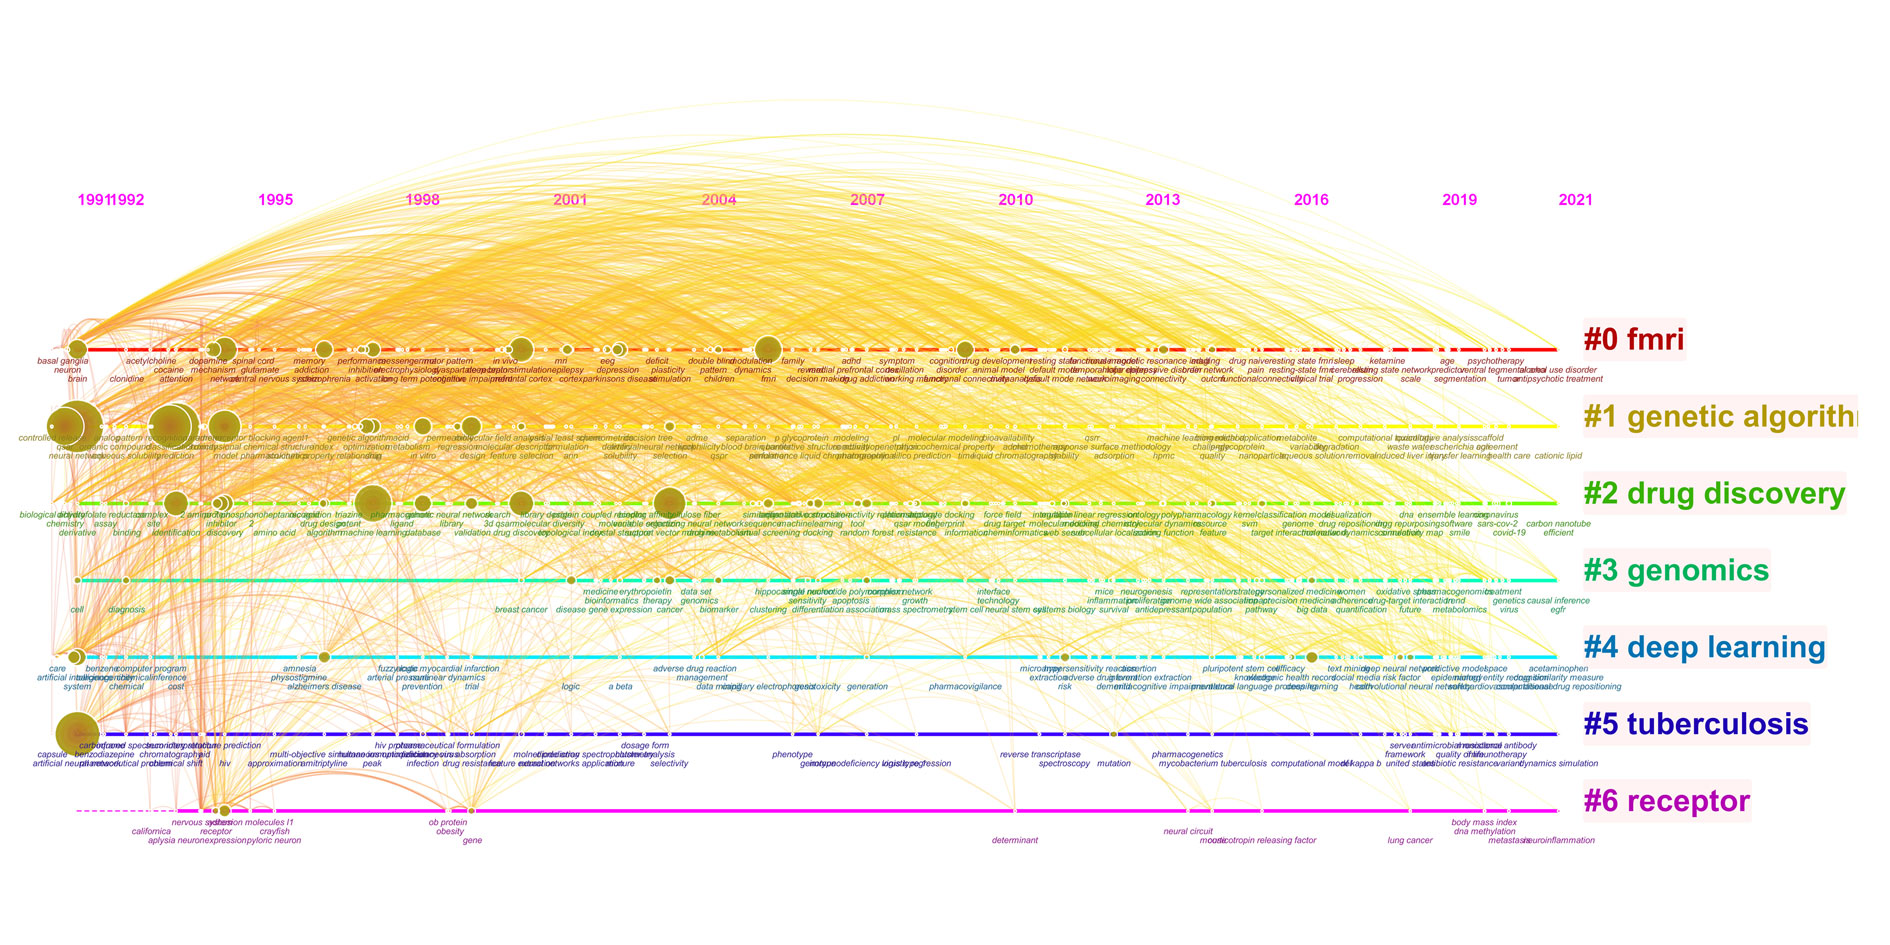 Figure 6. Clustering of keywords for application of ML in pharmacy.
|
Table 1. The top 10 countries and organizations participating in ML in pharmacy studies. |
||||
|
Rank |
Country |
Count |
Organization |
Count |
|
1 |
United States |
4119 |
University of California System |
429 |
|
2 |
China |
1772 |
Harvard University |
379 |
|
3 |
England |
1102 |
University of London |
286 |
|
4 |
Germany |
908 |
Chinese Academy of Sciences |
221 |
|
5 |
Italy |
516 |
University of Texas System |
182 |
|
6 |
Canada |
484 |
Institut National De La Sante Et De La Recherche Medicale |
187 |
|
7 |
Japan |
474 |
Pennsylvania Commonwealth System of Higher Education |
158 |
|
8 |
Spain |
468 |
National Institutes of Health |
216 |
|
9 |
France |
450 |
University of Cambridge |
179 |
|
10 |
Switzerland |
376 |
Centre National De La Recherche Scientifique |
204 |
|
Table 2. The top 10 journals publishing on the application of ML in pharmacy studies. |
||||
|
Rank |
Journal |
Count |
IF2020# |
Q* |
|
Journal of Chemical Information and Modeling |
280 |
4.549 |
Q1 |
|
|
2 |
PLOS ONE |
249 |
2.740 |
Q2 |
|
3 |
Scientific Reports |
191 |
3.998 |
Q1 |
|
4 |
BMC Bioinformatics |
166 |
3.242 |
Q2 |
|
5 |
108 |
5.610 |
Q1 |
|
|
6 |
Journal of Biomedical Informatics |
86 |
3.526 |
Q2 |
|
7 |
Journal of Cheminformatics |
86 |
5.318 |
Q3 |
|
8 |
IEEE Access |
85 |
3.745 |
Q1 |
|
9 |
Molecular Informatics |
85 |
2.741 |
Q4 |
|
10 |
Molecules |
83 |
3.267 |
Q2 |
|
#IF: Impact Factor; *Q: Quartile in Category. |
||||
|
Table 3. The top 10 authors and co-cited references of shared decision-making studies. |
||||
|
Rank |
Author |
Count |
Co-cited reference |
Count |
|
1 |
Schneider G |
77 |
Breiman L, 2001, Mach Learn, V45, P5[11] |
455 |
|
2 |
Zhang Y |
74 |
Cortes C, 1995, Mach Learn, V20, P273[12] |
455 |
|
3 |
Ekins S |
58 |
Lecun Y, 2015, Nature, V521, P436[24] |
429 |
|
4 |
Gonzalez-Diaz H |
52 |
Svetnik V, 2003, J Chem Inf Comp Sci, V43, P1947[13] |
412 |
|
5 |
Wang Y |
49 |
Pedregosa F, 2011, J Mach Learn Res, V12, P2825[14] |
410 |
|
6 |
Li Y |
45 |
Rogers D, 2010, J Chem Inf Model, V50, P742[25] |
394 |
|
7 |
Chen YZ |
43 |
Gaulton A, 2012, Nucleic Acids Res, V40, Pd1100[26] |
392 |
|
8 |
Zhang L |
43 |
Ma JS, 2015, J Chem Inf Model, V55, P263[27] |
384 |
|
9 |
Wang L |
41 |
Weininger D, 1988, J Chem Inf Comp Sci, V28, P31[28] |
377 |
|
10 |
Wang J |
39 |
Lipinski CA, 1997, Adv Drug Deliver Rev, V23, P3[29] |
368 |
|
Table 4. The top 20 keywords with strong burst strength in ML studies. |
|||||
|
Rank |
Keyword |
Strength |
Rank |
Keyword |
Strength |
|
1 |
Neural network |
150.81 |
11 |
Binding |
21.81 |
|
2 |
Artificial neural network |
69.00 |
12 |
Descriptor |
21.03 |
|
3 |
Deep learning |
58.66 |
13 |
Convolutional neural network |
19.63 |
|
4 |
QSAR |
41.90 |
14 |
QSPR |
18.04 |
|
5 |
Support vector machine |
38.93 |
15 |
ANN |
17.98 |
|
6 |
FMRI |
29.72 |
16 |
Working memory |
17.93 |
|
7 |
Genetic algorithm |
26.33 |
17 |
Aqueous solubility |
17.28 |
|
8 |
Drug design |
23.31 |
18 |
Functional connectivity |
17.09 |
|
9 |
Partial least square |
23.19 |
19 |
Molecular descriptor |
16.79 |
|
10 |
Prefrontal cortex |
22.06 |
20 |
Structure property relationship |
15.35 |
This study was supported by the National Natural Science Foundation of China (Nos. 82274313, 82204761 and 81901869).
Ethics approval and consent to participate
None.
Funding
Not applicable.
Author contributions
Yi Ding, Weiliang Ye and Jingwen Wang conceived of the study and supported the funding. Min Bai, Na Cui, and Yucheng Liao collected data, analyzed the results, and drafted the manuscript. Chao Zhao, Cao Shanshan, Kexin Sun, and Na Jia participated in its design and coordination. All authors read and approved the final manuscript.
Competing interests
All authors declare no competing interests. None of the authors has a financial conflict of interest related to this study.
- Janiesch C, Zschech P, Heinrich K: Machine learning and deep learning. Electronic Markets 2021, 31: 685-695.
- Deo RC: Machine Learning in Medicine. Circulation 2015, 132(20): 1920-1930.
- Handelman GS, Kok HK, Chandra RV, Razavi AH, Lee MJ, Asadi H: eDoctor: machine learning and the future of medicine. J Intern Med 2018, 284(6): 603-619.
- Saheb T, Saheb M: Analyzing and Visualizing Knowledge Structures of Health Informatics from 1974 to 2018: A Bibliometric and Social Network Analysis. Healthc Inform Res 2019, 25(2): 61-72.
- Grear T, Avery C, Patterson J, Jacobs DJ: Molecular function recognition by supervised projection pursuit machine learning. Sci Rep 2021, 11(1): 4247.
- Rupp M, Bauer MR, Wilcken R, Lange A, Reutlinger M, Boeckler FM, Schneider G: Machine Learning Estimates of Natural Product Conformational Energies. Plos Computational Biology 2014, 10(1): e1003400.
- Siegismund D, Tolkachev V, Heyse S, Sick B, Duerr O, Steigele S: Developing Deep Learning Applications for Life Science and Pharma Industry. Drug Res (Stuttg) 2018, 68(6): 305-310.
- Chen C, Dubin R, Kim MC: Emerging trends and new developments in regenerative medicine: a scientometric update (2000 - 2014). Expert Opin Biol Ther 2014, 14(9): 1295-1317.
- Chen C: Searching for intellectual turning points: progressive knowledge domain visualization. Proc Natl Acad Sci USA 2004, 101 Suppl 1: 5303-5310.
- Lu C, Li X, Yang K: Trends in Shared Decision-Making Studies From 2009 to 2018: A Bibliometric Analysis. Front Public Health 2019, 7: 384.
- Lipinski CA, Lombardo F, Dominy BW, Feeney PJ: Experimental and computational approaches to estimate solubility and permeability in drug discovery and development settings. Adv Drug Deliv Rev 2001, 46(1-3): 3-26.
- C. C: Support-Vector Networks. Machine Learning 1995, 20(3): 273-297.
- Svetnik V, Liaw A, Tong C, Culberson JC, Sheridan RP, Feuston BP: Random forest: a classification and regression tool for compound classification and QSAR modeling. J Chem Inf Comput Sci 2003, 43(6): 1947-1958.
- Pedregosa F, Varoquaux G, Gramfort A, Michel V, Thirion B, Grisel O, Blondel M, Prettenhofer P, Weiss R, Dubourg V et al: Scikit-learn: Machine Learning in Python. J Mach Learn Res 2011, 12: 2825-2830.
- Romero L, Portillo-Salido E: Trends in Sigma-1 Receptor Research: A 25-Year Bibliometric Analysis. Front Pharmacol 2019, 10: 564.
- Zhang RH, Li XL, Zhang XJ, Qin HY, Xiao WL: Machine learning approaches for elucidating the biological effects of natural products. Nat Prod Rep 2021, 38(2): 346-361.
- Koromina M, Pandi MT, Patrinos GP: Rethinking Drug Repositioning and Development with Artificial Intelligence, Machine Learning, and Omics. OMICS 2019, 23(11): 539-548.
- Badillo S, Banfai B, Birzele F, Davydov, II, Hutchinson L, Kam-Thong T, Siebourg-Polster J, Steiert B, Zhang JD: An Introduction to Machine Learning. Clin Pharmacol Ther 2020, 107(4): 871-885.
- Zarkogianni K, Athanasiou M, Thanopoulou AC, Nikita KS: Comparison of Machine Learning Approaches Toward Assessing the Risk of Developing Cardiovascular Disease as a Long-Term Diabetes Complication. IEEE J Biomed Health Inform 2018, 22(5): 1637-1647.
- Youshia J, Ali ME, Lamprecht A: Artificial neural network based particle size prediction of polymeric nanoparticles. Eur J Pharm Biopharm 2017, 119: 333-342.
- Wang J, Zhang X, Cheng L, Luo Y: An overview and metanalysis of machine and deep learning-based CRISPR gRNA design tools. RNA Biol 2020, 17(1): 13-22.
- Yang X, Wang YF, Byrne R, Schneider G, Yang SY: Concepts of Artificial Intelligence for Computer-Assisted Drug Discovery. Chemical Reviews 2019, 119(18): 10520-10594.
- Xie LW, He S, Song XY, Bo XC, Zhang ZN: Deep learning-based transcriptome data classification for drug-target interaction prediction. Bmc Genomics 2018, 19(Suppl 7): 667.
- LeCun Y, Bengio Y, Hinton G: Deep learning. Nature 2015, 521(7553): 436-444.
- Rogers D, Hahn M: Extended-Connectivity Fingerprints. J Chem Inf Model 2010, 50(5): 742-754.
- Gaulton A, Bellis LJ, Bento AP, Chambers J, Davies M, Hersey A, Light Y, McGlinchey S, Michalovich D, Al-Lazikani B et al: ChEMBL: a large-scale bioactivity database for drug discovery. Nucleic Acids Res 2012, 40(Database issue): D1100-1107.
- Ma JS, Sheridan RP, Liaw A, Dahl GE, Svetnik V: Deep Neural Nets as a Method for Quantitative Structure-Activity Relationships. J Chem Inf Model 2015, 55(2): 263-274.
- Weininger D: SMILES, a chemical language and information system. 1. Introduction to methodology and encoding rules. J Chem Info Comp Sci 1988, 28(1): 31-35.
- Lipinski CA, Lombardo F, Dominy BW, Feeney PJ: Experimental and computational approaches to estimate solubility and permeability in drug discovery and development settings. Adv Drug Deliv Rev 1997, 46(1-3): 3-26.
Asia-Pacific Journal of Pharmacotherapy & Toxicology
p-ISSN: 2788-6840
e-ISSN: 2788-6859
 Copyright © Asia Pac J Pharmacother Toxicol. This work is licensed under a Creative Commons Attribution-NonCommercial-No Derivatives 4.0 International (CC BY-NC-ND 4.0) License.

 Submit Manuscript